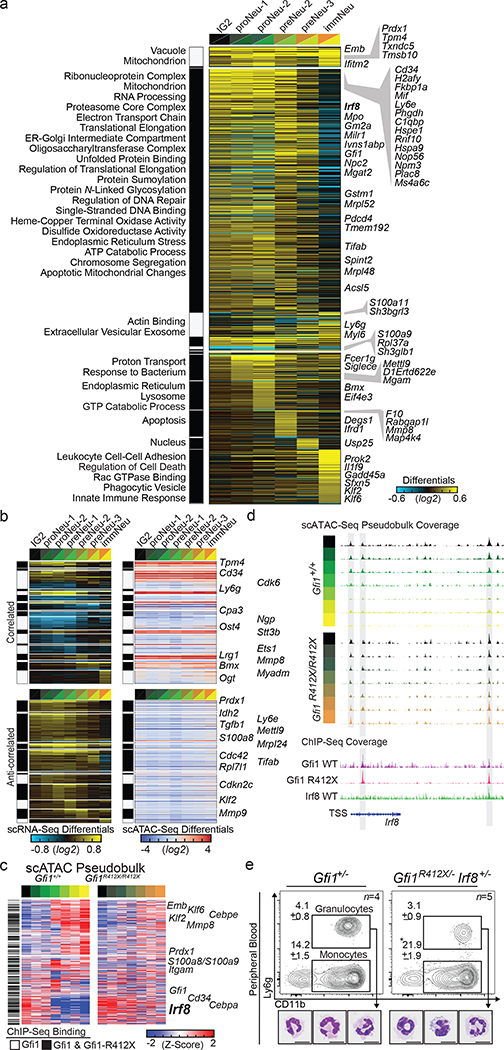
Figure 3. A single mutation in a lineage-determining transcription factor differentially impacts target gene expression in distinct cell states.
a, cellHarmony differential expression heatmap. scRNA-Seq libraries from Gfi1R412X/- and Gfi1+/− mice were analyzed (10X 3’ mod-GMP gate and Ly6ghigh GMP-P gate), then restricted to Gfi1 ChIP-Seq targets (841 out of 1462 total), and genes commonly deregulated across 10x and Fluidigm platforms are displayed (right)(see Extended Data Fig. 6k). Each row represents a single gene, each column the fold difference, and enriched Gene Ontology terms (left). b, Differential cicero gene activity scores correlated (top) or anticorrelated (bottom) with scRNA-Seq differentially expressed genes (from panel a). c, Heatmaps of scATAC-Seq pseudo-bulk data from Gfi1 and Gfi1-R412X bound loci (black bars on left, and see Extended Data Fig. 8e). ICGS clusters (top). Each row is a gene locus (right). d, Schematic of the Irf8 locus displaying scATAC-Seq pseudobulk accessibility with regions bound by Gfi1 shaded (top). ChIP-Seq reads (bottom). ICGS clusters (left). e, FACS plots and representative cytospins of FACS-sorted CD11b+ Ly6g+ cells from adult murine peripheral blood. In e, data are displayed as mean ± s.e.m. from independent biological replicates; * p < 0.05 as determined by two-tailed t-test, and scale bars represent 10 μm.

