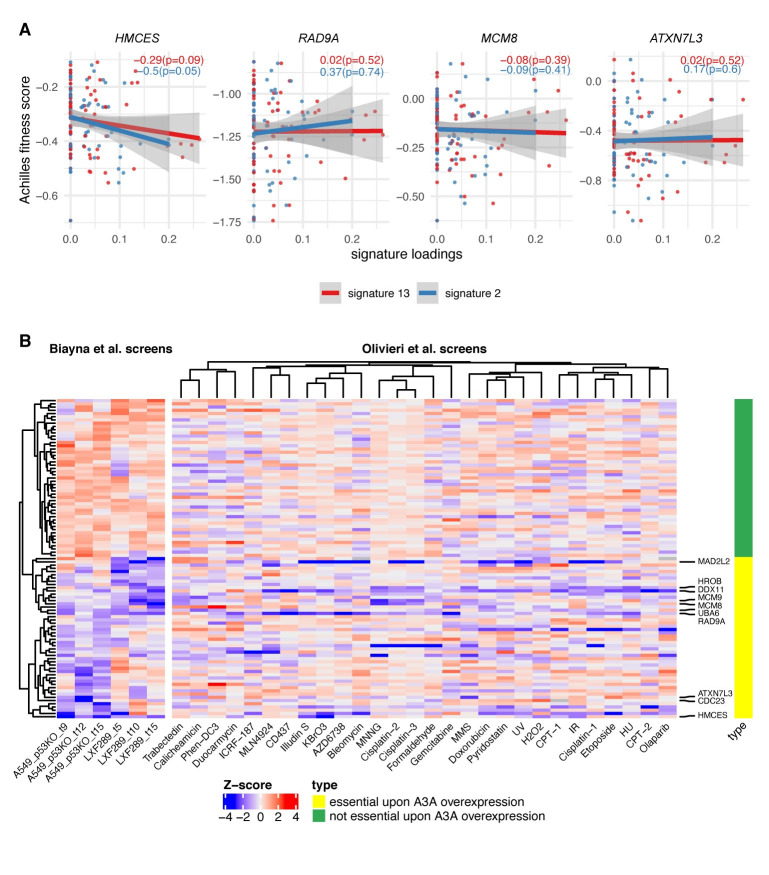
Fig 3. Dependency on HMCES is associated with mutational signatures of APOBEC across 76 lung and head and neck cancer cell lines.
(A) Gene essentiality fitness score from Project Achilles vs. APOBEC mutational signatures exposures, for cell lines from head and neck squamous cell carcinoma, LUAD, and lung squamous cell carcinoma, in four of the genes with the greatest overall score in our screens; see S5 Table and S7 Fig for associations with additional prominent genes. The slope and p-value (1-tailed, lower) for the regression model for both A3 signatures are shown within each panel. The more negative the slope, the more sensitive the cell lines are to the depletion of the gene at a higher level of the APOBEC signature. (B) Heatmap shows a gene-level normalized LFC (gene essentiality score) upon A3A overexpression for 2 cell lines and for 3 time points (Biayna et al. screens); right panel shows Z-scores of gene essentiality after genotoxin exposure (Olivieri et al. screens[60]). Data for 50 genes that are essential upon A3A overexpression in our screens (i.e., genes with the most negative mean LFC across 6 data points) and 50 nonessential genes upon A3A overexpression in our screens. Labels on the right-hand side highlight the 10 genes showing the highest overall A3A essentiality. An extended heatmap showing all genes from certain DNA repair pathways is included in S7 Fig, and numerical data for graphs in this figure are provided in S3 Data. A3A, APOBEC3A; LFC, log2 fold change; LUAD, lung adenocarcinoma.

