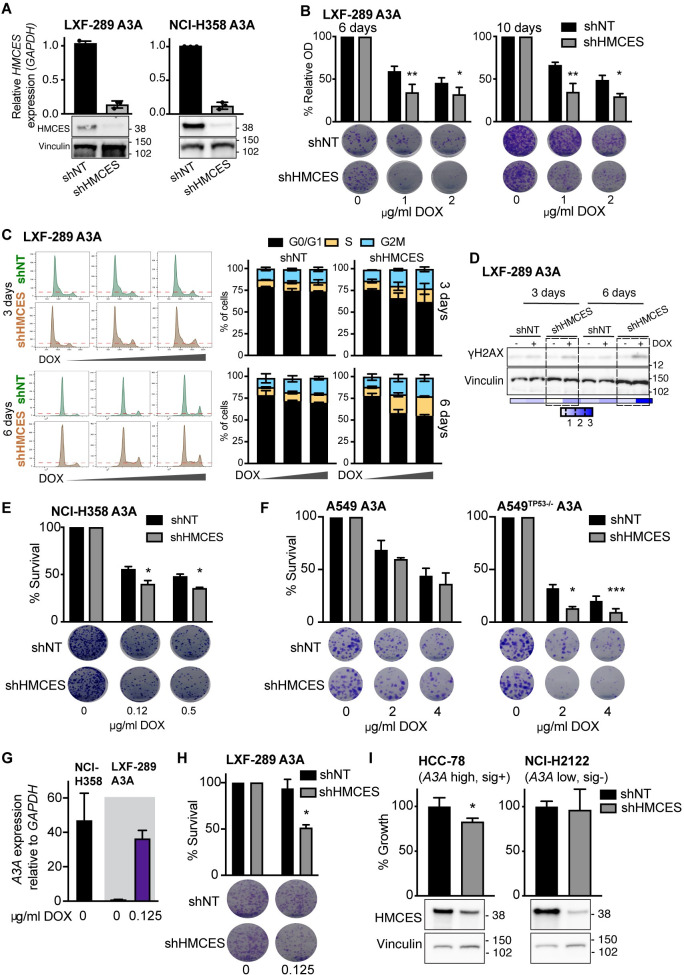
Fig 4. Validation of the effects of HMCES depletion in multiple genetic backgrounds.
(A) HMCES levels in LXF-289 A3A and NCI-H358 A3A cell lines by qRT-PCR and western blot following transduction with shHMCES or a shNT. The qRT-PCR validation was repeated at least 3 times. Molecular mass is indicated in kilodaltons. (B) Reduction of HMCES sensitizes LXF-289 A3A cells to A3A expression in a growth assay for 6 and 10 days (repeated 3 times). (C) Representative histograms of cell cycle progression (left panels) and quantitative analysis of LXF-289 A3A shHMCES and shNT (right panels). Cells were treated with DOX (0, 1, or 2 ug/ml) and harvested after 3 and 6 days (repeated 2 times). (D) Western blot of H2AX-S139 phosphorylation (γH2AX) in LXF-289 shHMCES and shNT cells after 3–6 days of A3A expression. Relative phosphorylation (0–3) was calculated normalizing the band densities of γH2AX to total Vinculin signal. Molecular mass is indicated in kilodaltons. (E) Reduction of HMCES sensitizes NCI-H358 A3A cells to A3A expression in a clonogenic survival assay after 15 days (repeated 2 times). (F) The effect of HMCES depletion is TP53 dependent. Clonogenic survival assays of A549 A3A or A549TP53−/− A3A cells are shown 10 days after treatment with the indicated dose of DOX (repeated 3 times). (G) A3A mRNA expression levels in LXF-289 A3A (0 and 0.125 ug/ml of DOX) and the parental NCI-H358 cell line relative to GAPDH measured by qRT-PCR (repeated 3 times). (H) Depletion of HMCES sensitizes LXF-289 A3A cells to A3A expression following low levels of DOX treatment in a clonogenic survival assay (repeated 3 times). (I) Growth inhibition (percentage of growth rate) measured with AlamarBlue for HCC-78 (A3A expressing, A3 mutational signature positive) and NCI-H2122 (A3A low, A3 mutational signature negative) cell lines transduced with shNT or shHMCES (repeated 3 times). HMCES levels are shown, and Vinculin is used as a loading control (bottom panels). Statistical analysis of shHMCES vs. shNT in all panels was performed using a 1-tailed unpaired t test; mean and SD are shown for all graphs. *, p ≤ 0.05, **, p ≤ 0.01, ***, p ≤ 0.001. Uncropped western blots are provided in S1 Raw Images, and numerical data for all graphs are provided in S4 Data. A3A, APOBEC3A; DOX, doxycycline; qRT-PCR, quantitative real-time PCR; SD, standard deviation; shNT, nontargeting shRNA.

