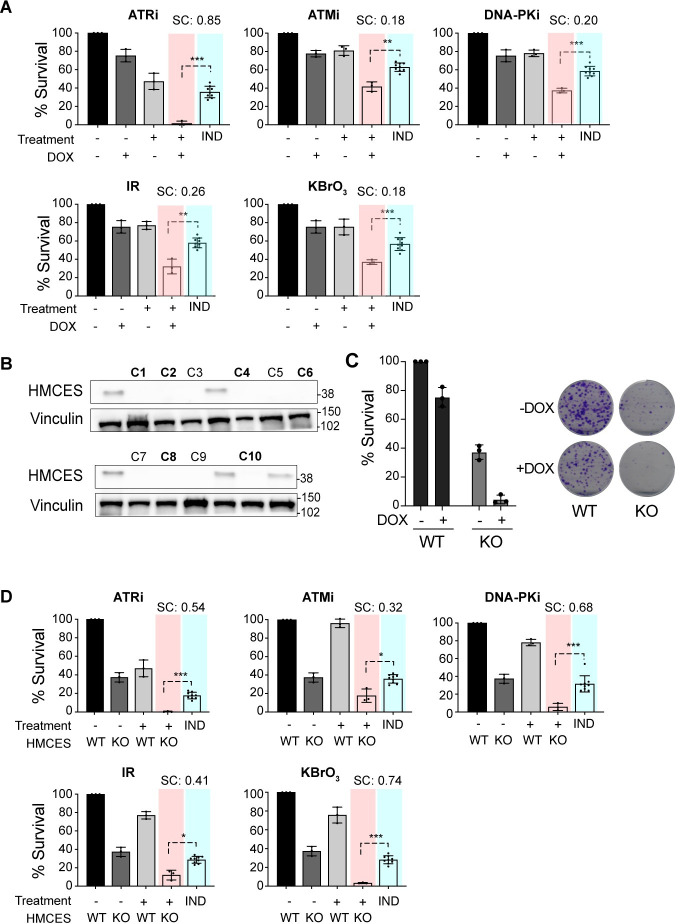
Fig 5. A3A expression sensitizes to DNA damage and HMCES loss.
(A) Clonogenic survival measured by the colony formation assay in LXF-289 A3A cells after exposure to the indicated small molecule inhibitor, IR (5 Gy), or treatment with 0.1 mM KBrO3 with or without DOX (0.125 ug/ml) to induce A3A expression. (B) HMCES western blot of lysates from LXF-289 A3A HMCES WT and KO clones. Vinculin was used as a protein loading control, and molecular mass is indicated in kilodaltons. (C) Clonogenic survival assay of LXF-289 A3A HMCES WT and KO cells upon overexpression of A3A by DOX. (D) Clonogenic survival assay comparing HMCES WT and KO cells after treatment with the indicated small molecule inhibitor, exposure to IR (5 Gy), or treatment with 0.1 mM KBrO3 with or without DOX to induce A3A expression. For panels A and D, the “IND” column shows a Bliss independence model of additive activity of the 2 treatments, against which the combined treatment is tested (using t test, 2-tailed) to estimate synergistic activity [66]. Mean and SD are shown in all graphs. *, p ≤ 0.1, **, p ≤ 0.05 ***, p ≤ 0.01. Each experiment was repeated 3 times, and primary numerical data are provided in S5 Data. A3A, APOBEC3A; DOX, doxycycline; IR, ionizing radiation; KO, knockout; SC, synergy score; SD, standard deviation; WT, wild-type.

