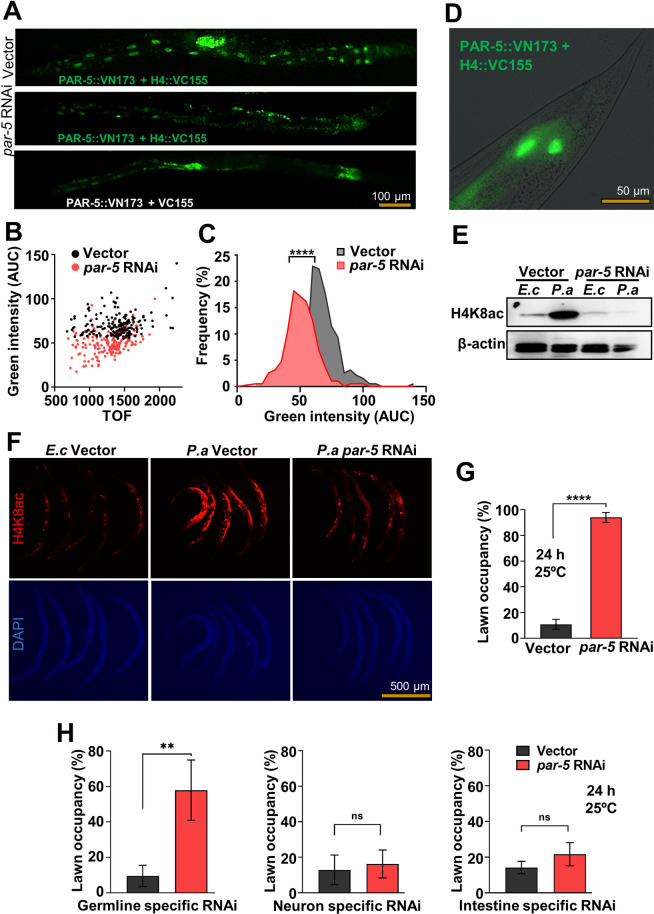
Fig 3. PAR-5 is required for P. aeruginosa H4K8ac in the germline.
(A) Representative microscopic images of vector control or par-5 RNAi animals expressing BiFC constructs 12 hours after heat shock at 33°C. Control animals without the H4::VC155 construct were used to establish the background fluorescence. (B) Dot-plot representation of green fluorescence intensity versus TOF of vector or par-5 RNAi BiFC animals. (C) Frequency distribution of green fluorescence-AUC of vector and par-5 RNAi transgenic BiFC animals. Three independent experiments were performed. “*” indicates significant difference; **** P ≤ 0.0001. (D) High-magnification fluorescent micrograph of nuclear localization of PAR-5 protein, post 12 hours heat shock recovery. (E) Western blot of extracts from fer-1(b232) animals exposed to E. coli (E. c) or P. aeruginosa (P. a) for 24 hours at 25°C following par-5 RNAi at 25°C (n ≈ 1,000; representative of 3 independent experiments). The fer-1(b232) and glp-1(e2141) animals were maintained at 15°C. To induce sterility, L1-stage animals were transferred to 25°C and allowed to develop into L4s. L4 animals were transferred to RNAi plates and allowed to grow for 24 hours at 25°C. (F) Whole-mount immunofluorescence profile of wild-type animals stained with anti-H4K8ac, post exposure to E. coli (E. c) or P. aeruginosa (P. a) for 24 hours at 25°C following par-5 RNAi for 24 hours at 25°C. (G) Lawn occupancy of wild-type N2 animals at 24 hours of exposure to P. aeruginosa following par-5 RNAi at 25°C (n = 20). Three independent experiments were performed. “n” represents the number of animals for each experiment. “*” asterisk indicates significant difference; **** P ≤ 0.0001. (H) Lawn occupancy of tissue-specific RNAi animals at 24 hours of exposure to P. aeruginosa following par-5 RNAi in the germline, neurons, or the intestine at 25°C (n = 20). Four independent experiments were performed. “n” represents the number of animals for each experiment. “*” asterisk indicates significant difference; “ns” indicates nonsignificant; ** P ≤ 0.005. See S1 Raw Images for uncropped immunoblot images and S1 Data for the corresponding data. AUC, area under the curve; BiFC, bimolecular fluorescence complementation; H4K8ac, histone H4 Lys8 acetylation; RNAi, RNA interference; TOF, time of flight.

