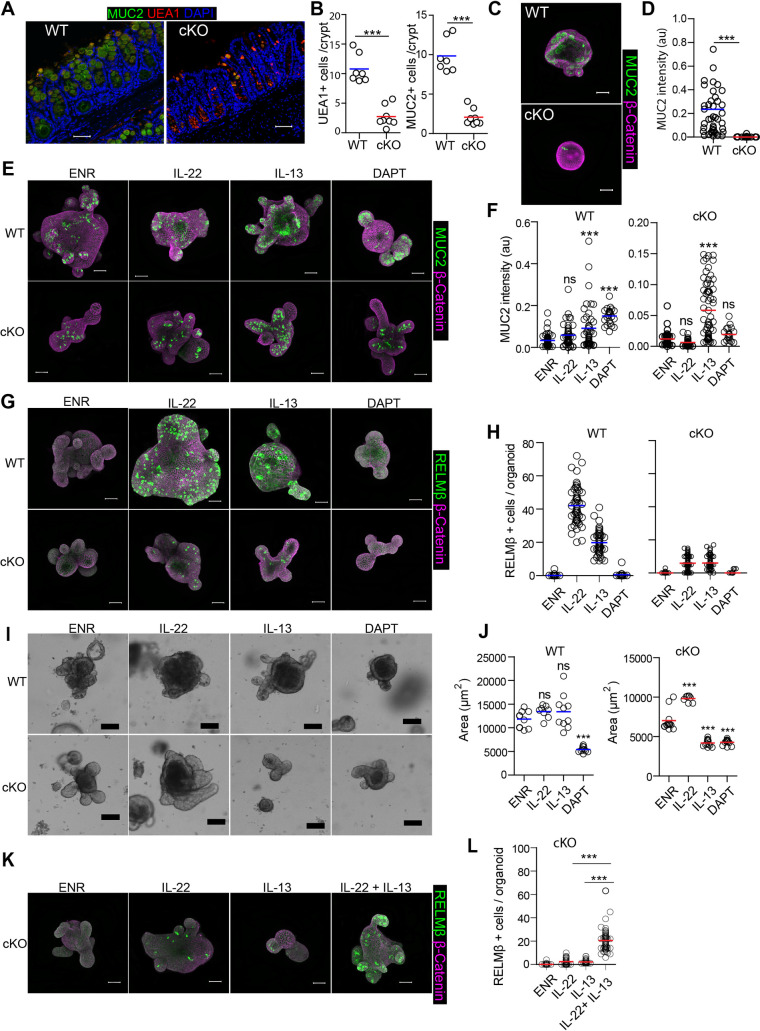
Fig 5. LSD1 controls (immune-driven) goblet cell responses.
(A) Colon sections of WT and cKO mice were stained for MUC2 (green), Ulex europaeus agglutinin I (UEA1) (red). UEA1 is a lectin which binds to glycoproteins and glycolipids and used as an additional marker for goblet cells. DAPI (blue) used as a counterstaining. (B) Quantification of MUC2+ cells and UEA1+ cells in the colon of WT (n = 7) and cKO (n = 8) mice. (C) WT and cKO colon organoids were seeded in ENR for 4 days and immunofluorescent staining of MUC2 (green) and β- catenin (purple) was performed. (D) Quantification of MUC2 intensity per colon organoid is represented. Colon organoids were derived from WT (n = 2) and cKO (n = 2) mice. (E&G) Immunofluorescent confocal images for MUC2 (E, green) and RELMβ (G, green) in WT and cKO organoids left untreated in ENR or supplemented with IL-13 (10 ng/ml), IL-22 (5ng/ml) or DAPT 10 μM for 4 days. DAPI was used to stain nuclei (blue). (F&H), Quantification of MUC2 fluorescence intensity (F) and number of RELMβ positive cells (H) per organoid. (I) Representative bright field images of WT and cKO organoids treated with IL-13 (10 ng/ml), IL-22 (5ng/ml) and DAPT 10 μM for 4 days. Scale bar is 100μm. (J) Quantification of organoid area from minimal projections 4 days after seeding. Dots represents the mean of one well. Images are representative of 3 independent experiments. (K) cKO organoids were treated with IL-13 (10 ng/ml), IL-22 (5ng/ml) and combination of IL-13 + IL-22 for 4 days. Immunofluorescent images of RELMβ (green) and β-catenin (purple). (L) Quantification of RELMβ+ cells per organoid are shown. Unpaired two-tailed Student’s t test (B & D) and One-way analysis of variance with Tukey’s Multiple Comparison Test (F, H, J& L) was performed to observe significant differences. ns = not significant, * P ≤ 0.05, **, P < 0.01, *** P ≤ 0.001.

