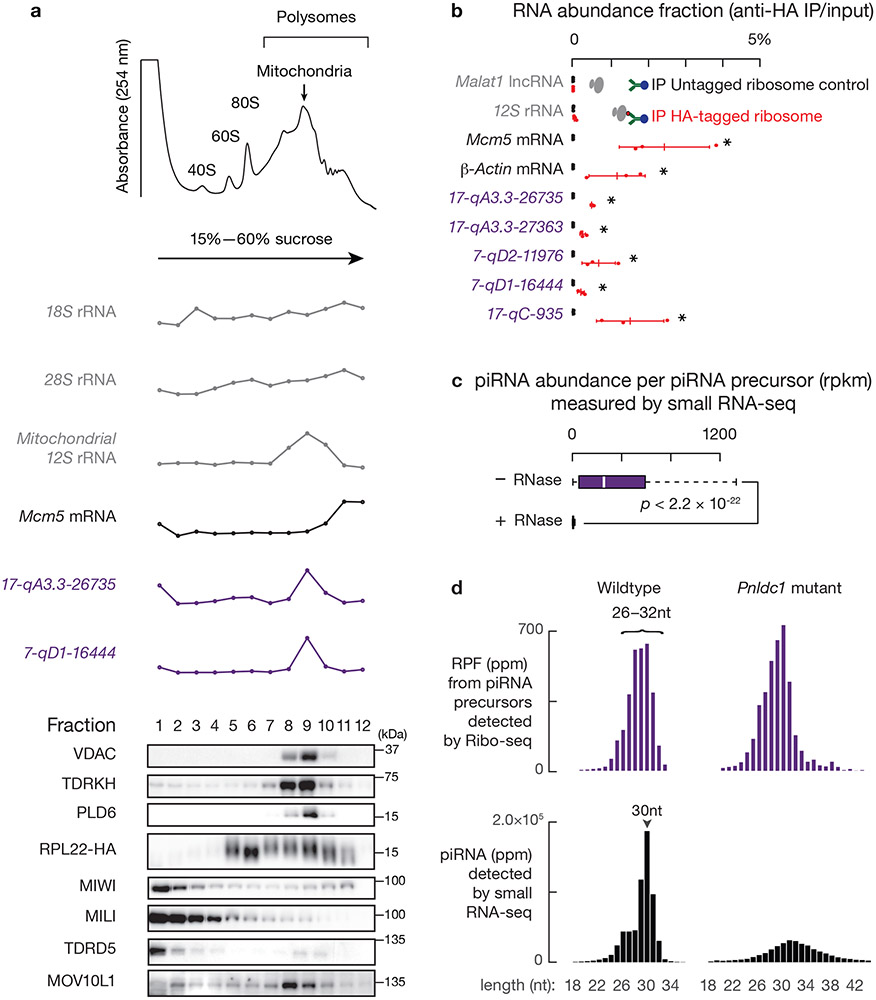
Fig. 1. Pachytene piRNA precursors associate with ribosomes.
a, (upper) A254 absorbance profile of testis lysates from adult mice following separation in 15% to 60% sucrose density gradients. The testes were lysed in amended lysis buffer that preserves mitochondria. Top to bottom: relative abundance of 18S rRNA, 28S rRNA, 12S rRNA, Mcm5 mRNA, and two pachytene piRNA precursors: 17-qA3.3-26735 and 7-qD1-16444. The long transcripts (> 200 nt) were quantified using RT-qPCR, and were normalized to spike-in control RNAs. (lower) Western blot analysis of VDAC (mitochondrial outer membrane protein49), TDRKH (also localized on the outer membrane of clustered mitochondria), PLD6, HA-tagged RPL22, MIWI, MILI, TRDR5 and MOV10L1. Experiments were repeated for at least three times independently with similar results. b, Fraction of RNAs immunoprecipitated using anti-HA antibodies relative to total input RNAs from Ddx4-cre:RiboTag mice (red) and control littermates (RiboTag without Cre, black). (The scheme of the experimental procedure is shown in Extended Data Fig. 2e.) 17-qA3.3-26735, 17-qA3.3-27363, 7-qD2-11976, 7-qD1-16444, and 17-qC-935 are pachytene piRNA precursors. Abundance of transcripts was quantified using RT-qPCR (sample size n = 3 independent biological samples). Data are mean ± standard deviation; *p < 0.05, one-side Student’s t-test. Each data point was overlaid as dot plots. c, Boxplots of pachytene piRNA abundance per piRNA precursor with and without RNaseA&T1 treatment. Box plots: 25th and 75th percentiles; whiskers: 5th and 95th percentiles; midline, median (the same definition was used throughout the manuscript). Sample size n = 100 pachytene piRNA precursors. p value was determined by two-side paired Wilcoxon signed-rank test. Rpkm, reads per kilobase pair per million reads mapped to the genome. d, Length histograms of RPFs from pachytene piRNA precursors (upper) and of pachytene piRNAs (bottom) in the testis of wildtype (left) and Pnldc1 mutants (right). Ppm, parts per million. See also Extended Data Fig. 2, 3. Statistical source data are provided in Source Data Fig.1. Unprocessed blots are provided in Source Data Fig 1.

