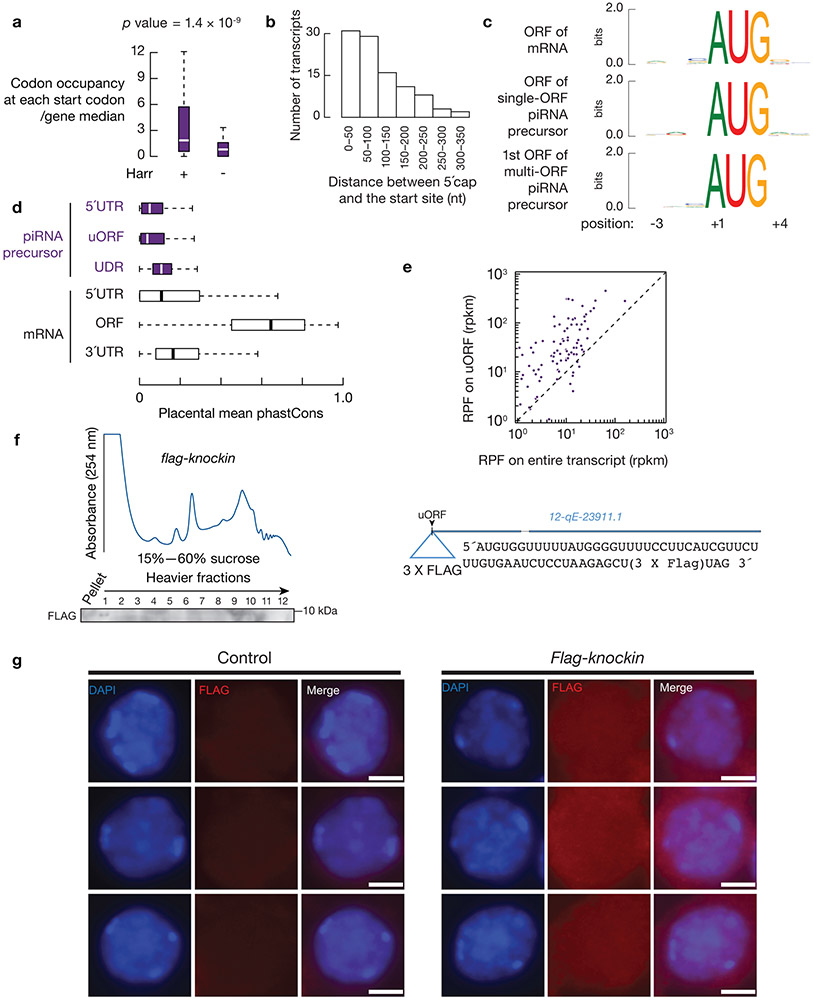
Extended Data Fig. 5. uORFs on the piRNA precursors recruit ribosomes through canonical translation initiation.
a, Boxplots of RPF abundance at each start codon relative to the median density across the gene with and without harringtonine (Harr) treatment. The occupancy at a codon 20, 40, and 60 positions downstream of the start codon is depicted as a control. Sample size n = 100 pachytene piRNA precursors. Experiments have been repeated from two independent biological samples and mean is used for plotting. p value was determined by two-side paired Wilcoxon signed-rank test. b, Histogram of the distance from the 5´-cap to the start codon. AUG start sites typically fall in the first few hundred nt of transcripts. c, Sequence logos depicting the KOZAK consensus sequences. The start codons of single-ORF transcripts displayed weaker KOZAK consensus sequence with the critical A at the −3 position and the critical G at the +4 position. The A at the AUG codon being the +1. The start codons of the first ORFs for multi-ORF transcripts lack the critical A at the −3 position and the critical G at the +4 position. d, Boxplots of the mean PhastCons score72 (probability that each nucleotide belongs to a conserved element) of the genomic regions of putative 5´-UTR, uORF, and UDR of pachytene piRNA precursors, and 5´-UTR, ORF, and 3´-UTR of pachytene expressed mRNAs among placental mammals. Sample size n = 100 pachytene piRNA precursors; Sample size n =115 pachytene expressed mRNAs. e, Scatterplots of RPF abundance in ORFs relative to the overall abundance on the transcript from adult wild-type testes. f, A254 absorbance profile of testis lysates from Flag-knockin mice following separation in 15% to 60% sucrose density gradients. Western blot analysis of the FLAG-tagged micropeptide from testes of flag-knockin mice with anti-FLAG antibodies. Scheme of the flag-knockin mice was listed on the right. Experiments have been repeated for two times independently with similar results. g, Immunolabeling of squashed pachytene spermatocytes from flag-knockin mice and from control mice. Three examples of each genotype were shown using anti-FLAG, DAPI, and merged. Statistical Source Data are provided in Source Data Extended Data Figure 5. Unprocessed blots are provided in Source Data Extended Data Figure 5.

