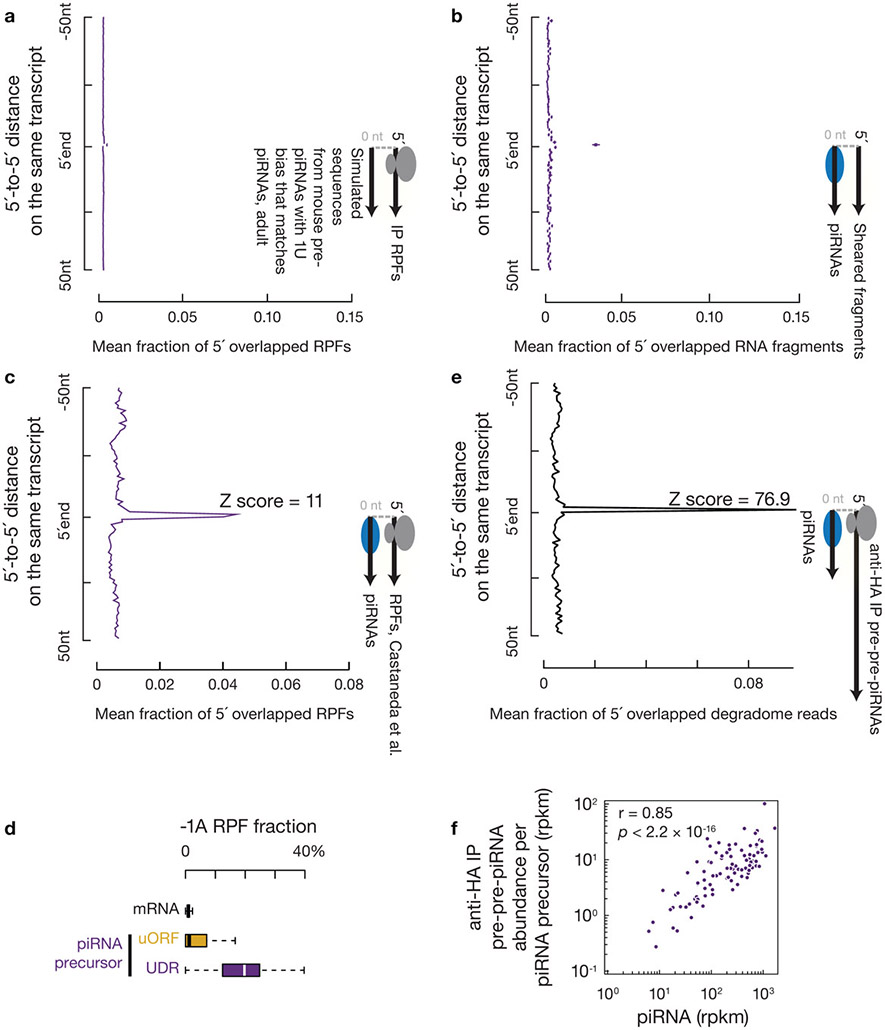
Extended Data Fig. 7. Ribosomes bind piRNA precursors at the future piRNA sites.
a, Boxplots of distance spectra of 5´-ends of anti-HA immunoprecipitated RPFs from adult testis that overlap simulated sequences. The 5´-end overlap analyses between RPFs and simulated sequences were computed 10,000 times (sample size n = 10,000 5´-end overlap analyses). b, Boxplots of distance spectra of 5´-ends of sheared RNA fragments that overlap piRNAs of adults. The sheared RNA fragments were randomly downsampled 10,000 times to match the read numbers of RPFs immunoprecipitated from adult testis (sample size n = 10,000 5´-end overlap analyses). c, Distance spectrum of 5´-ends of RPFs from a publicly available dataset42 that overlap piRNAs from our dataset. We believe the higher accessibility of RNase I (used in42) compared to RNaseT1&A (used in this study) sometimes clipped one nucleotide from the 5´-end and resulted in a peak at the second position. Experiments have been repeated from two independent biological samples and mean is used for plotting. Higher accessibility of RNase I compared to Xrn1 has been reported66. d, Boxplots of the fraction of RPF with a 5´ upstream A in total RPFs per transcript. Mean of three biological replicates of anti-HA immunoprecipitated RPFs from adult testis were used. e, Distance spectra of 5´-ends of anti-HA immunoprecipitated degradome reads that overlap piRNAs in adults. f, Scatterplots of piRNA abundance versus 5´P RNA abundance (anti-HA immunoprecipitated degradome reads) from adults per pachytene piRNA precursors (sample size n = 100 pachytene piRNA precursors). Rpkm, reads per kilobase pair per million reads mapped to the genome. The partial Spearman’s correlation efficient and the corresponding p-value based on two-sided Spearman’s correlation test were listed, controlling for the piRNA precursor level measured by RNA-seq. Statistical Source Data are provided in Source Data Extended Data Figure 7.

