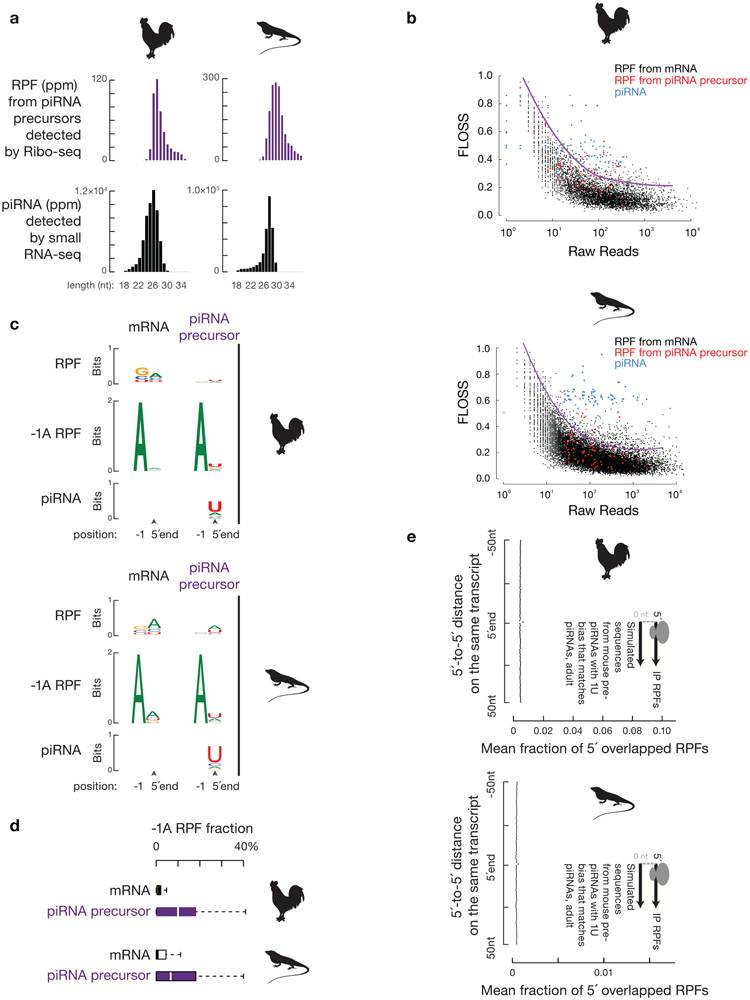
Extended Data Fig. 10. Ribosome-mediated piRNA biogenesis is conserved.
a, Length histograms of RPFs from piRNA producing loci (upper) and of piRNAs (bottom) in the testis of roosters (left) and green lizards (right). Ppm, parts per million. b, Fragment length analysis plot of total RPF reads per transcript and FLOSS relative to the nuclear coding sequence average from testes of roosters (upper) and green lizards (bottom). For different raw read counts, to detect extremely large FLOSS values, outlier cutoffs were calculated using Tukey’s fences method and smoothed using LOESS regression. piRNAs were downsampled to match the read number of RPFs from piRNA precursors before calculating FLOSS. c, Sequence logos depicting the nucleotide bias at 5´-ends and 1 nt upstream of the 5´-ends of total RPF species (top) and RPF species with a 5´-upstream A (bottom) from roosters and green lizards. d, Boxplots of the fraction of RPF with a 5´-upstream A in total RPFs per transcript in roosters (upper) and green lizards (lower). Sample size n = 9,461 rooster mRNAs; sample size n = 95 rooster piRNA clusters. Sample size n = 14,680 lizard mRNAs; sample size n = 94 lizard piRNA clusters. e, Boxplots of distance spectra of 5´-ends of anti-HA immunoprecipitated RPFs from adult testis that overlap simulated sequences. The 5´-end overlap analyses between RPFs and simulated sequences were computed 10,000 times for roosters (upper) and green lizards (lower) (sample size n =10,000 5´-end overlap analyses). Statistical Source Data are provided in Source Data Extended Data Figure 10.

