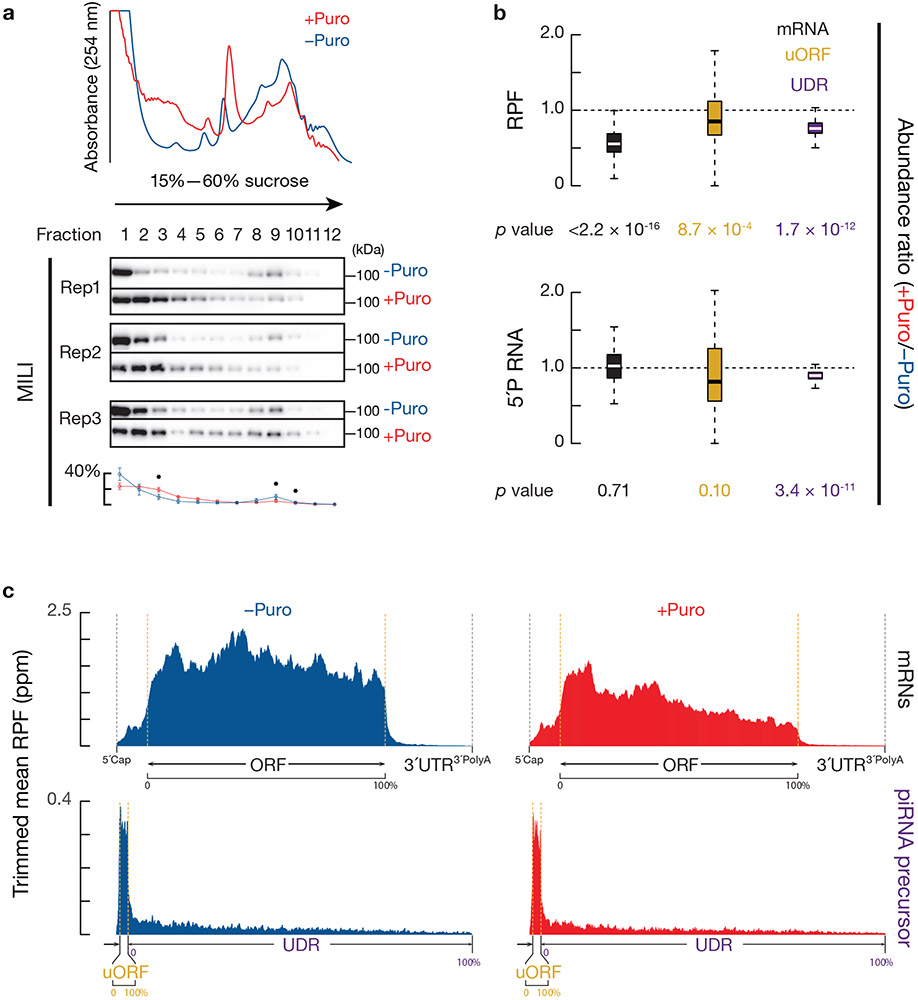
Fig. 7. Decrease in piRNA processing intermediates upon temporal ribosome depletion.
a, (upper) A254 absorbance profile of testis lysates from adult mice with (red) and without (blue) puromycin treatment following separation in 15% to 60% sucrose density gradients. (lower) Western blot analysis of MILI with barplots showing their quantification (n = 3 independent biological samples; mean ± standard deviation); *p < 0.05, one-side Student’s paired t-test. Puro, puromycin. b, Boxplots of RPF abundance ratios (upper) and degradome abundance ratios (lower) of puromycin treated versus untreated testis from mRNA coding regions (gold) and from piRNA precursor uORFs and UDRs (purple). Lower panel shows 5´P decay intermediates from pachytene-expressed mRNA (gold) and pre-pre-piRNAs from uORFs and from UDRs (purple). Sample size n = 100 pachytene piRNA precursor UDRs and uORFs. Sample size n = 115 pachytene expressed mRNAs. p value was determined by two-side paired Wilcoxon signed-rank test. c, Aggregated data for ribosome occupancy on mRNAs (top) pachytene piRNA precursors (bottom) from untreated testis (left), and from puromycin treated testis (right) (10% trimmed mean).
See also Extended Data Fig. 9c,d. Statistical source data are provided in Source Data Fig.7. Unprocessed blots are provided in Source Data Fig 7.

