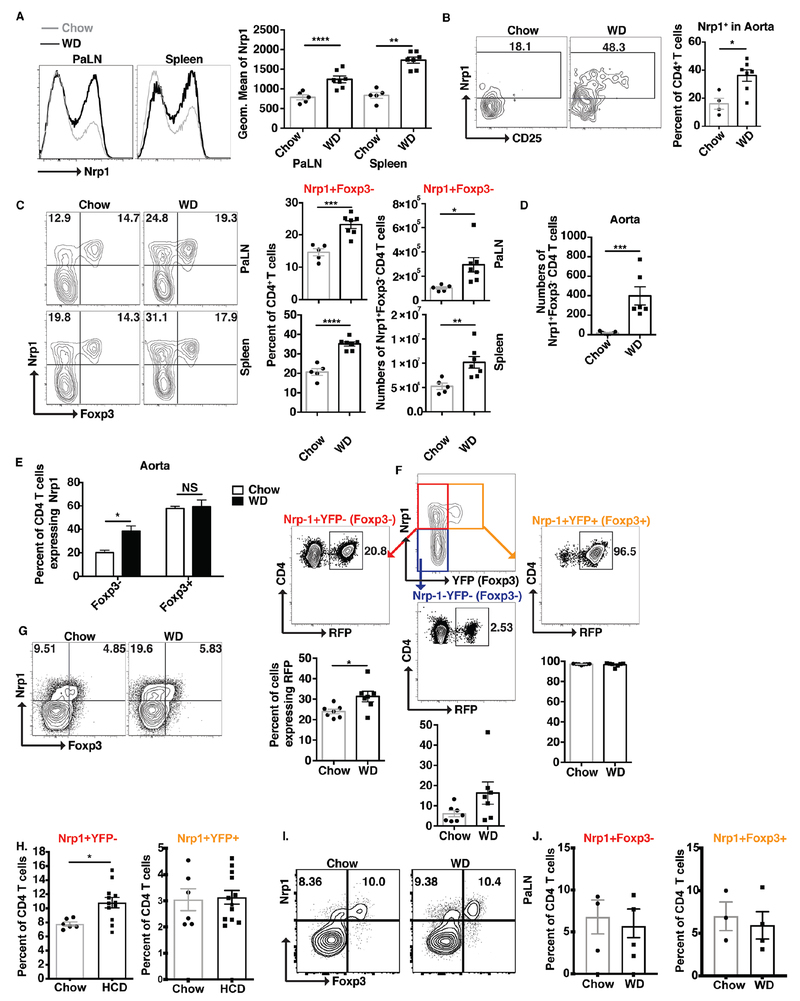
Figure 1: Nrp1+Foxp3− CD4 T cells are increased in atherosclerosis.
LT-ApoE−/− (A-F) or ApoE−/− (G) mice were fed a WD for 15 weeks, and CD4 T cells were examined for the expression of Nrp1. (A-B) Histograms, flow cytometry plots and graphs showing the expression of Nrp1 on CD4 T cells from PaLN, spleens (A), and aorta (B) from chow and WD-fed mice. (C-D) Flow cytometry plots and graphs showing the expression of Nrp1 and Foxp3 on CD4 T cells in the PaLN, spleens (C) and aorta (D) of the above mice. (E) Graphs showing the percentage of expression of Nrp1 on Foxp3− versus Foxp3+ CD4 T cells in the aorta of the above mice. (F) Distribution of Treg cell signature (RFP+) in the different CD4 T cell population based on the expression of Nrp1 and Foxp3. (G) Flow cytometry plots showing the expression of Nrp1 on CD4 T cells from PaLN from chow and WD-fed ApoE−/− mice. (H) Pooled frequencies of Nrp1+YFP− or Nrp1+YFP+ CD4 T cells in LT-Ldlr−/− mice at 6 weeks post high cholesterol diet (HCD) (n=6 (Chow); n=12 (HCD)). (I) Representative contour plots of Foxp3 by Nrp1 for B6 mice fed chow or WD for 3 weeks. (J) Pooled percentages of Nrp1+Foxp3− and Nrp1+Foxp3+ CD4 T cells from B6 mice fed a western diet for 3 weeks (n=3 mice/group). Results are expressed as the mean ± s.e.m from one of three independent experiments (n=5-7) (A-G), n=6 mice/group (chow), n=12 mice/group (HCD) (H) (one independent experiment), and 3 mice/group (Chow), n=4 mice/group (WD) (J, I) (one independent experiment). Statistically significant differences were at * P<0.05, ** P < 0.01, *** P < 0.001 and **** P < 0.0001.

