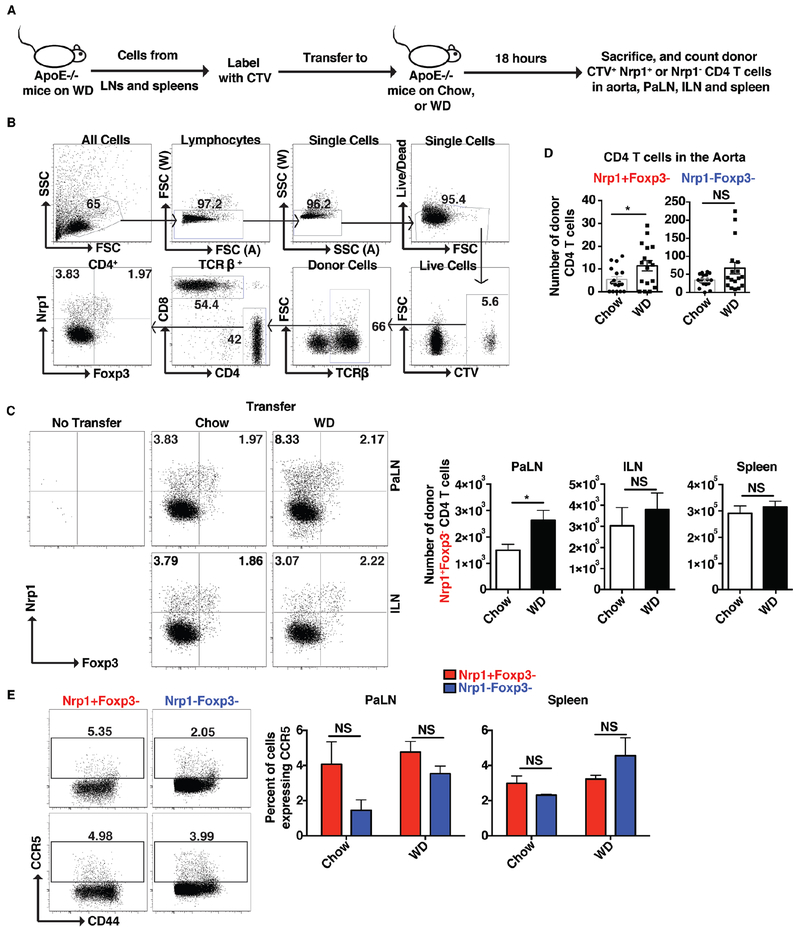
Figure 8: Nrp1+ facilitates the migration of CD4 T cells to the aorta.
(A) Experimental design: Lymphocytes from peripheral lymph nodes and spleens of ApoE−/− mice fed a WD for 15 weeks were labeled with CTV and equal numbers were transferred to age matched ApoE−/− mice fed either a chow or WD (for 15 weeks). Mice were sacrificed 18 hours later and donor cells were assessed. (B) Flow cytometry plots showing the gating strategy used to find the donor cells in the recipient mice. (C-D) Flow cytometry plots and/or graphs showing the percentages and numbers of donor CD4 T cells that migrated to the PaLN, ILN, spleen (C) or aorta (D). (E) Flow cytometry plots and graphs showing the expression of CCR5 on the Nrp1+Foxp3− versus Nrp1−Foxp3− CD4 T cells populations in PaLN and spleen. Results are expressed as the mean ± s.e.m from three independent experiments (n=11 (A-C), n=17 (D)), or one experiment (n=3 (E)). Statistically significant differences were at * P<0.05. NS = no significant differences.

