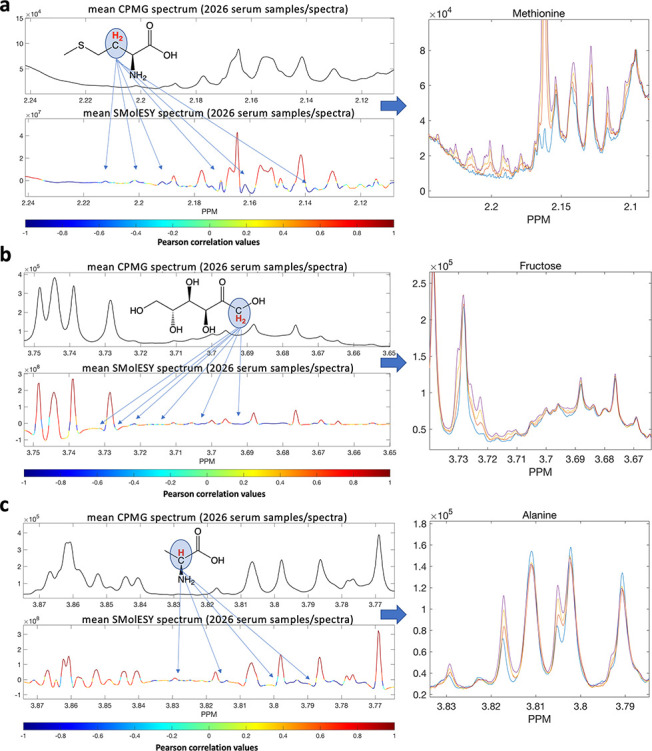
Figure 1.

Pearson linear correlation between 2026 plasma CPMG and SMolESY 1H NMR spectra. Correlation between each SMolESY feature versus its corresponding one in the CPMG shows the enhanced SM signals, highlighting the detection ability of SMolESY with respect to the spin–echo experiment (e.g., CPMG). Low correlated features correspond to being barely visible/highly overlapped by other signals/baseline in the CPMG, whereas in SMolESY, they are partially or totally deconvolved. By employing 2D 1H NMR correlation spectroscopy (COSY) and statistical correlation spectroscopy, (STOCSY;15Figure S1), we were able to assign several of these features, which were subsequently confirmed by spiking experiments (left-hand panels). Examples of resonances now visible in the SMolESY spectrum are shown in the right-hand panels: (a) methionine, (b) fructose, and (c) alanine.
