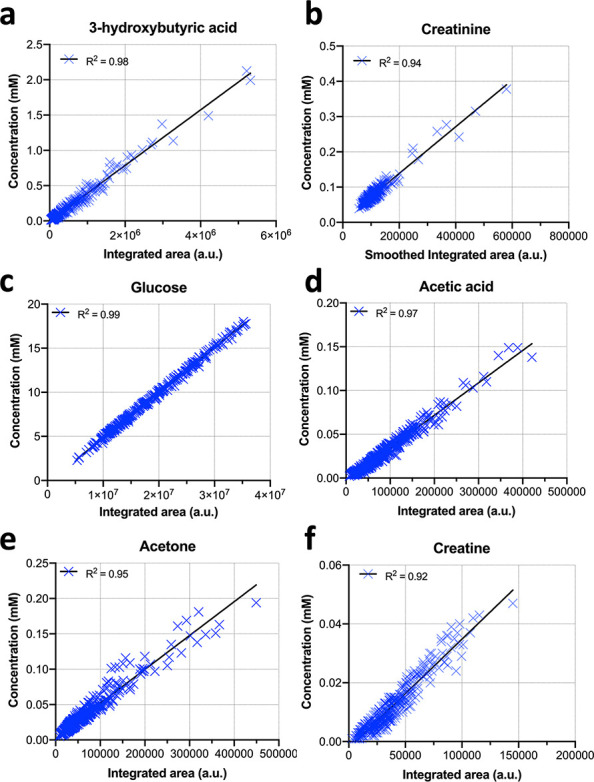
Figure 4.

Linear regression analyses of SMolESY integrals (normalized to one proton) versus absolute concentrations produced by commercial software for (a–f) six metabolites in 380 plasma samples from a diabetic cohort. The calculated R2 values indicate a good correlation between SMolESY feature integrals (independently of smoothing, e.g., panel (b)) and the concentration values from “expensive” fitting/deconvolution processes. Additional comparisons are presented in Figure S7.
