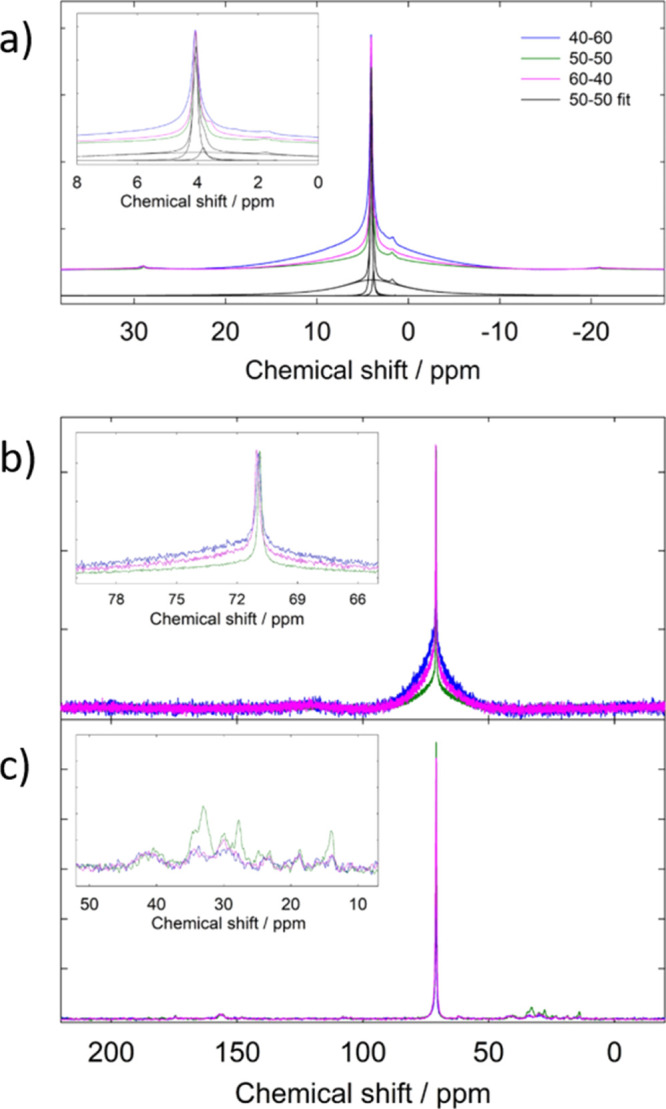
Figure 5.

(a) 1H spectra for the pristine blend 40–60 (blue), blend 50–50 (green), and blend 60–40 (pink) compositions; (b) 13C spectra for the pristine blend 40–60 (blue), blend 50–50 (green), and blend 60–40 (pink) compositions; and (c) 1H–13C CPMAS spectra for the blend 40–60 (blue), blend 50–50 (green), and blend 60–40 (pink) compositions.
