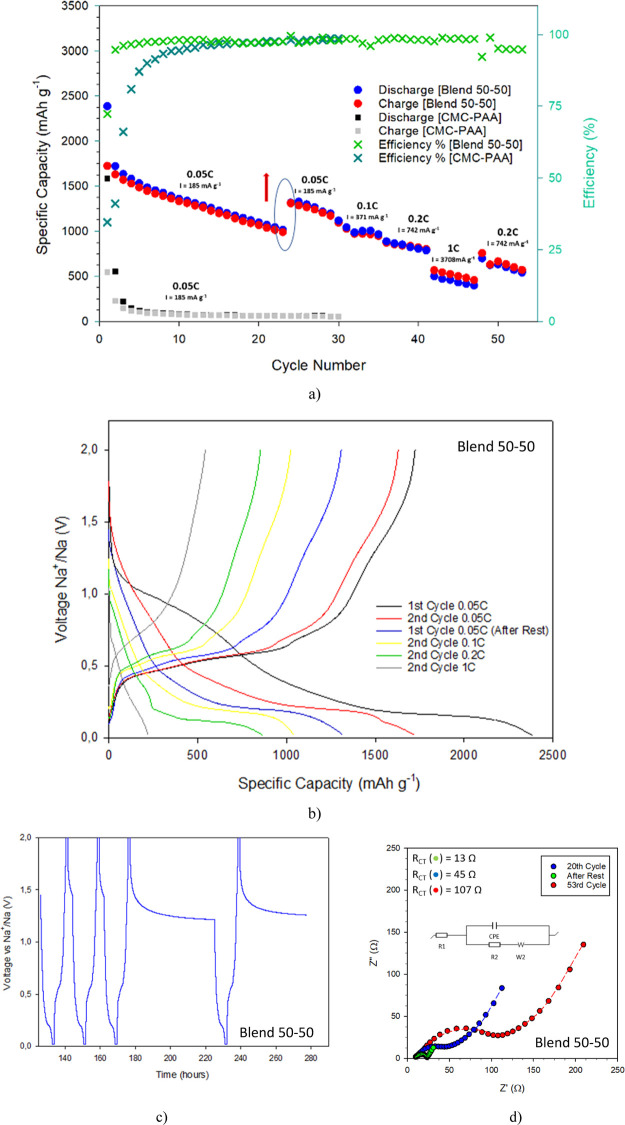
Figure 7.
(a) Comparison of the rate performances of two BP anodes (0.05 C: I = 185 mA g–1; 0.1C: I = 371 mA g–1; 0.2C: I = 742 mA g–1; and 1C: 3708 mA g–1), including the SH binder (circles, blue: discharge; red: charge; and light green: efficiency) and the conventional CMC–PAA (squares, black: discharge; gray: charge; and dark green: efficiency), (b) voltage profiles of the SH BP anode, (c) voltage profiles upon time at C/20 or 185 mA g–1 including a rest period of 48 h, and (d) Nyquist plots collected during and at the end of the galvanostatic cycling tests on the SH BP anode.

