Figure 6.
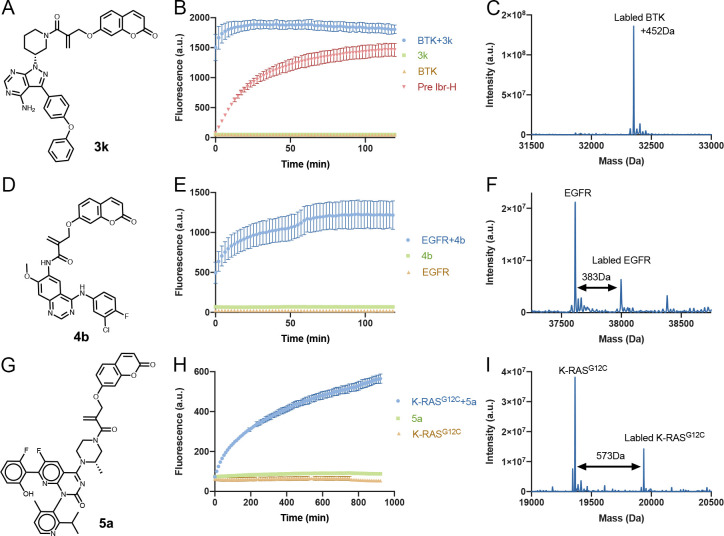
Turn-on fluorescent probes using CoLDR chemistry. (A, D, G) Structures of turn-on fluorescent probes for BTK, EGFR, and K-RasG12C, respectively. (B, E, H) Time dependence of fluorescence intensity (representing the release of the coumarin moiety) measured at Ex/Em = 385/435 nm (n = 3). Green curves show that the compounds in and of themselves (2 μM) are not fluorescent. Orange curves show that the proteins themselves (2 μM) are also not fluorescent. Only upon mixing of probe and target (blue curves) do we see an increase in fluorescence. (C, F, I) Deconvoluted LC/MS spectra for BTK, EGFR, and K-RasG12C incubated with 3k, 4b, and 5a at the end of each plate reader measurement. The adduct mass corresponds to a labeling event in which the coumarin moiety was released, validating the proposed mechanism. For BTK (D) we completed a reversible version of ibrutinib Ibr-H (2 μM; 0.5 h preincubation; Figure 4A) with 3k (red curve). This considerably slowed the release of coumarin and the corresponding increase in fluorescence. All error bars indicate standard deviation.

