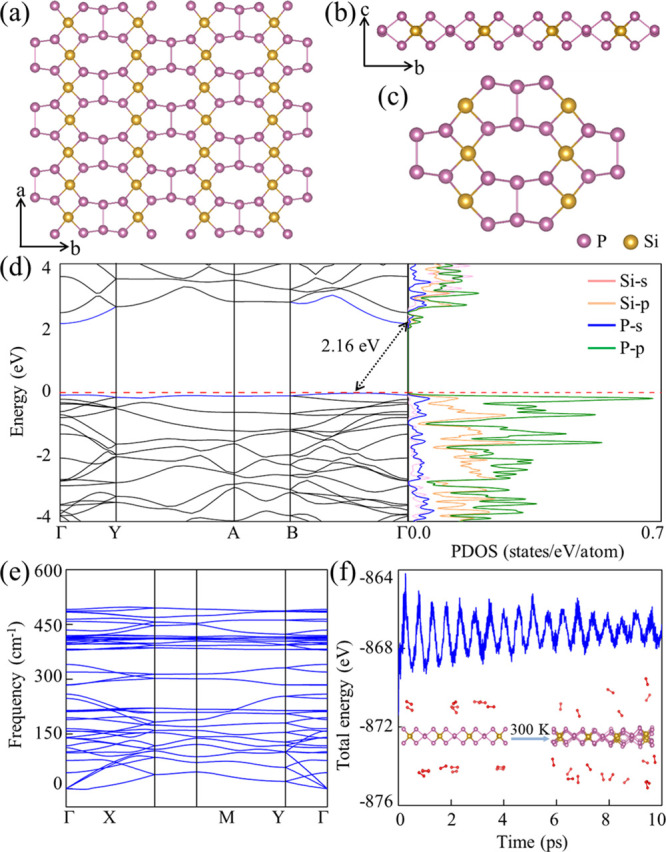
Figure 5.

(a) Top and (b) side views of the SiP3 monolayer and (c) basic building block (Si6P20). (d) Electronic band structure and PDOS. The horizontal dashed line is the VBM. (e) Phonon spectrum. Phonon densities of states can be found in Figure S1. (f) Total energy and snapshots of the SiP3 monolayer with 20 O2 molecules before and after a 10 ps MD simulation at 300 K.
