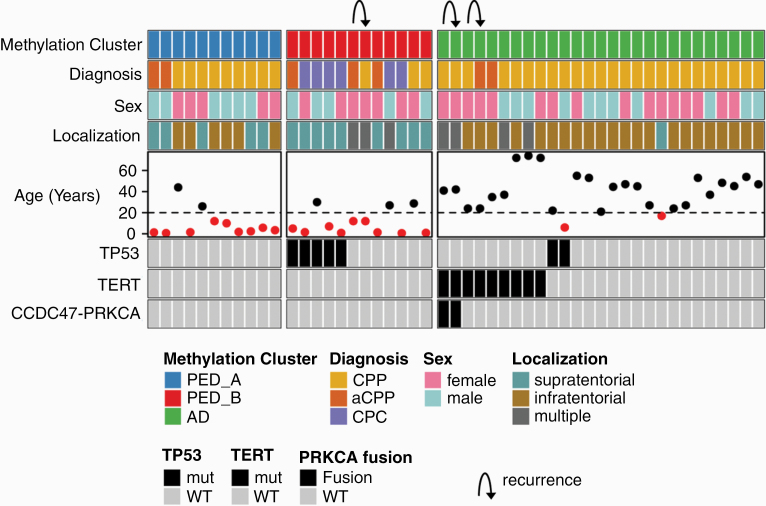
Fig. 1.
Summary of patient characteristics and molecular alterations in choroid plexus tumors. Summary plot showing DNA methylation subgroup, diagnosis, sex, localization and age as well as TP53, TERT and PRKCA-fusion status. Age below 20 years is indicated by red dots. Arrows indicate recurrences that belong to the same individual.

