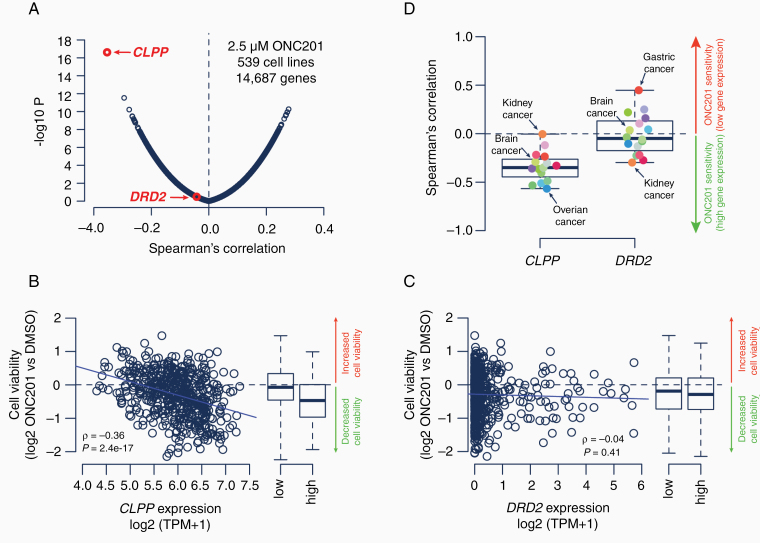
Fig. 2.
Comprehensive cell viability screen of human cancer cell lines identified ClpP as the primary predictor of ONC201 response. Correlation between cell viability at 2.5 μM ONC201 and gene expression levels (log2 TPM) across 539 human cancer lines from the Cancer Cell Line Encyclopedia (A). Scatter plots and boxplots show ONC201 sensitivity compared to gene expression levels for CLPP (B) and DRD2 (C). Box plots show Spearman’s ρ between ONC201 sensitivity and gene expression levels for 16 individual cancer types. Calculations are based on 11 (rhabdoid) to 106 (lung) cancer cell lines (D). All gliomas among brain cancer cell lines are IDH-wild type. Primary drug screening data for human cancer cell lines was derived from the PRISM Repurposing Screen (19Q3)54 and gene expression data from the Cancer Dependency Map (20Q3).57 Spearman’s ρ and -log10P values are shown. Boxplots show the first quartile, median value, third quartile, and minimum/maximum (whiskers) of the data. Blue lines show linear regression results between ONC201 sensitivity and gene expression levels. Classification of gene expression levels into low/high is based on median. DMSO, dimethylsulfoxide.

