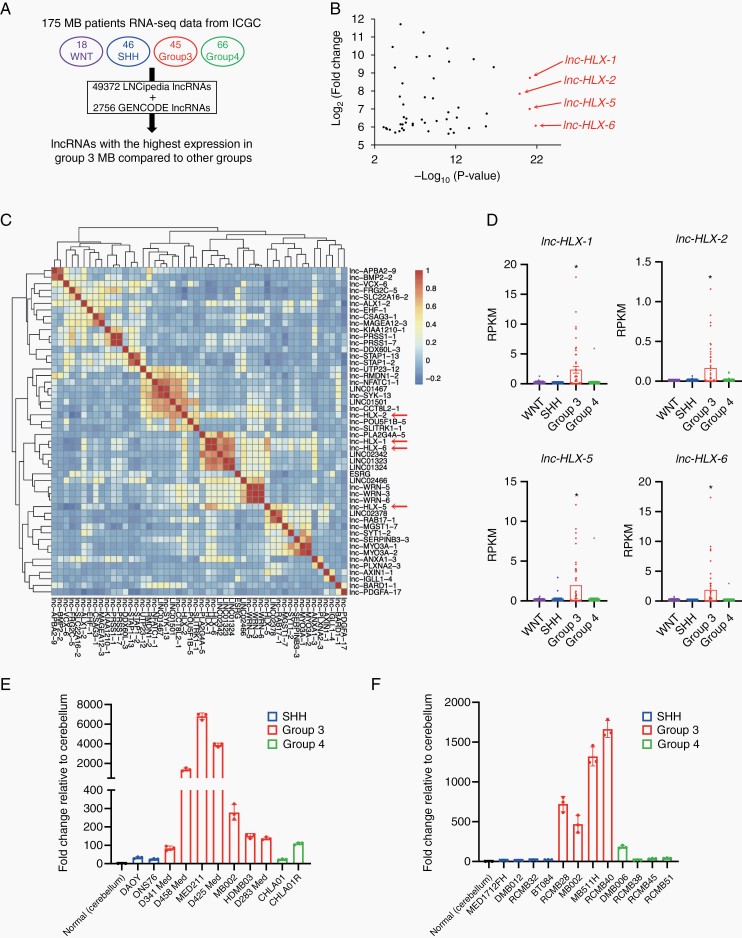
Fig. 1.
Identification and validation of the Group 3–specific lncRNA, lnc-HLX-2-7. (A) Schematic of the identification of Group 3–specific lncRNAs in the 4 MB subgroups (WNT, SHH, Group 3 and Group 4). (B) Top 50 lncRNAs with the highest expression in Group 3 MBs compared with other MB subgroups are shown. x-axis indicates P value (-log10) of each lncRNA and y-axis indicates fold change value (log2) of each lncRNA. (C) The heat map represents the similarity of expression within Group 3 MBs of each lncRNA shown in (B). (D) Boxplot showing distribution of normalized expression values of lnc-HLX-1, lnc-HLX-2, lnc-HLX-5, and lnc-HLX-6 in WNT, SHH, Group 3 and Group 4 MBs. Dots represent the expression value for each MB patient. *P< 0.01, Kruskal–Wallis analysis. (E, F) qRT-PCR analysis showing the distribution of normalized expression values of lnc-HLX-2-7 in MB cell lines (E) and PDX samples (F) of Group 3, Group 4, and SSH MBs. Values indicate fold change relative to cerebellum.

