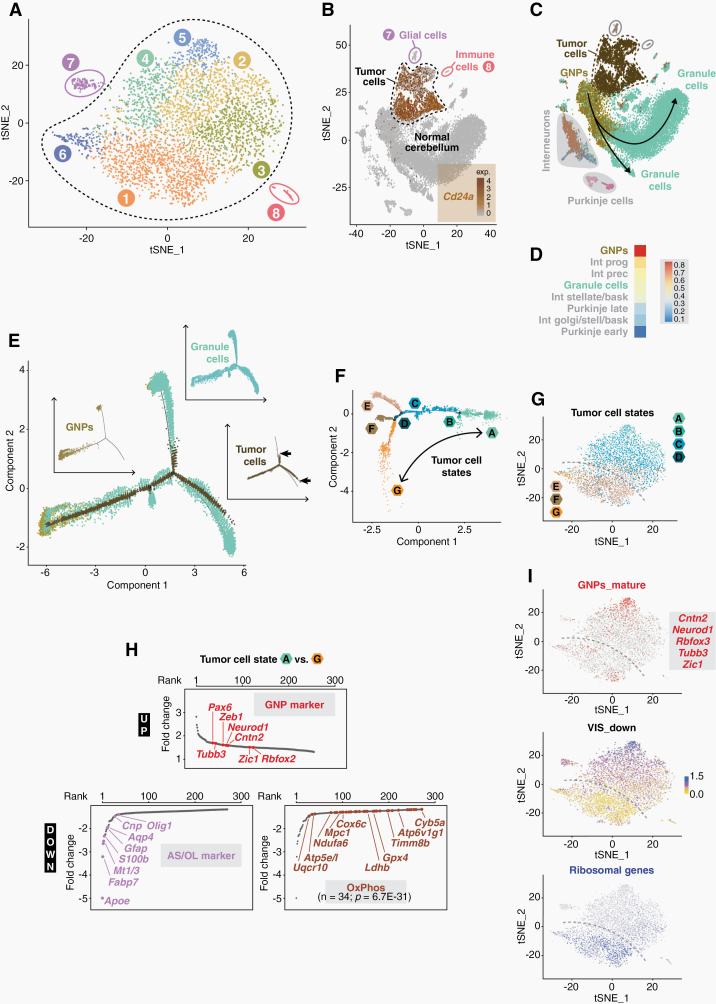
Fig. 1.
The transcriptome landscape of murine SHH medulloblastoma. (A) t-distributed stochastic neighbor embedding (t-SNE) analysis of cell clusters in SHH-MB tumors at P20. (B) t-SNE plot of Cd24a expression in SHH-MB cells and in cerebellar cells from healthy mice.23 (C) Relation of SHH-MB cells to different cell populations of the cerebellum. (D) Similarity of SHH-MB cells and different cerebellar cell types as calculated by a logistic regression-based model. (E) Pseudo-temporal lineage trajectory of granule cells in which SHH-MB tumor cells are embedded. The insets show the individual trajectories of the 3 cell populations separately, with arrows indicating the termination points of the tumor cell trajectory. (F) Intratumoral heterogeneity as determined by trajectory inference of pseudotime-ordered SHH-MB tumor cells. (G) t-SNE plot of tumor cell states. The dashed line illustrates the bisection into states ABCD and EFG. (H) Ranked list of differentially expressed genes between tumor cells states A and G. Various marker genes of granule neuron precursor (GNP) cells, astrocytes/oligodendrocytes (AS/OL) and oxidative phosphorylation (OxPhos) are highlighted. (I) t-SNE plots of markers for mature GNPs,13 of ribosomal gene expression, or of VIS_down, a gene expression signature found in SHH-MB tumor cells which are strongly depleted by vismodegib.14

