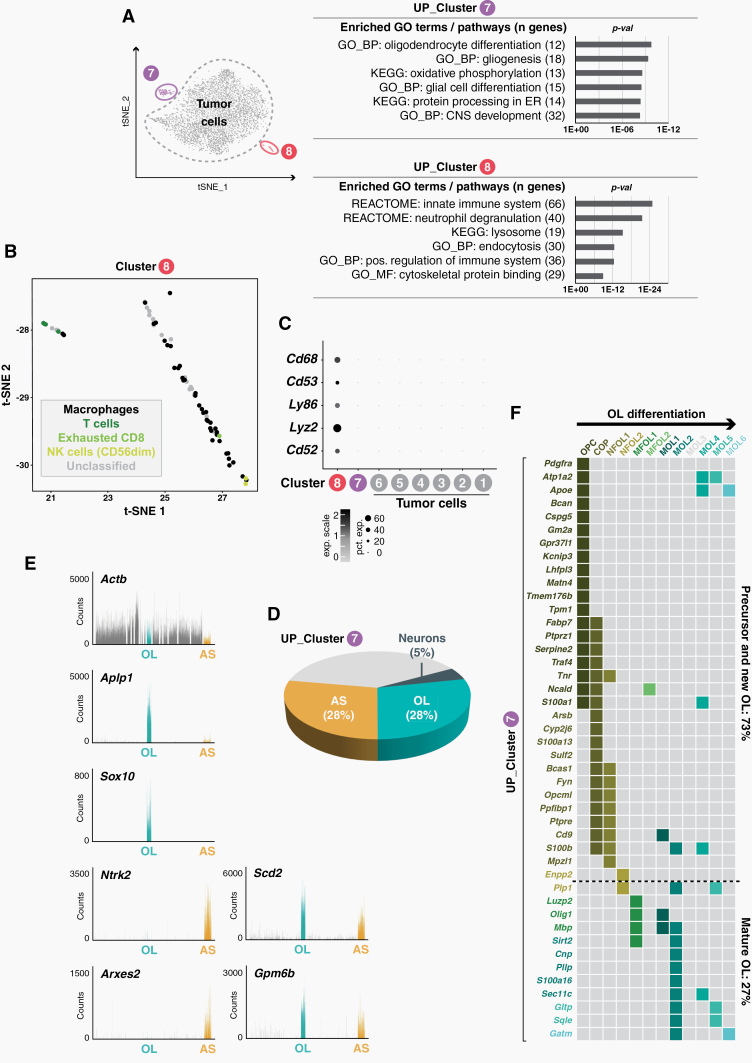
Fig. 2.
Tumor-associated glial and immune cells. (A) Gene ontology (GO) analysis of upregulated genes of clusters 7 and 8. (B) t-SNE plot showing immune cell phenotypes of cluster 8 cells based on the expression of cell type-specific marker genes.39 (C) Dot plot of immune cell marker genes in clusters 1–8. (D) Overlap of upregulated cluster 7 genes with astrocyte (AS), oligodendrocyte (OL) and neuron marker genes.28 (E) Upregulated cluster 7 genes are highly expressed in AS and OL cells as revealed by interrogation of a molecular atlas of cell types in the mouse brain vasculature.30 (F) A matrix showing stage-specific cluster 7 gene expression during OL differentiation.29

