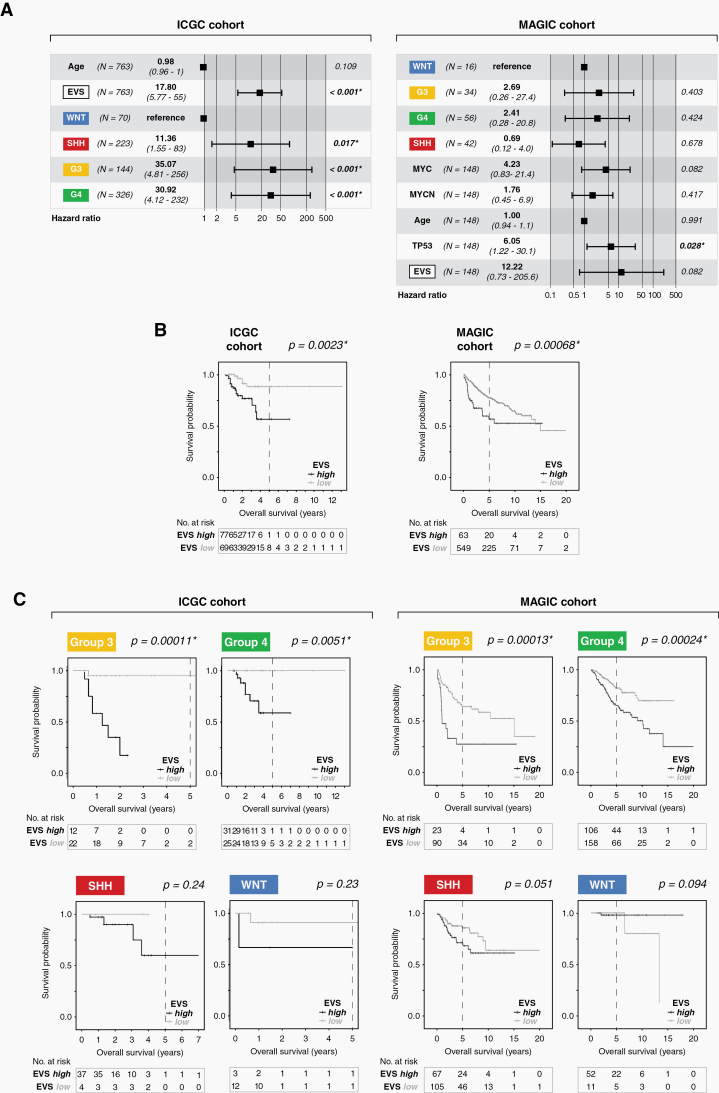
Fig. 6.
Prognostic value of EVS. (A) Forest plots showing hazard ratios and 95% confidence intervals associated with the indicated variables for the ICGC cohort (left) and MAGIC cohort (right). The hazard ratio HR was calculated using the EVS score as a continuous variable in a multivariate Cox regression model of overall survival. (B) Kaplan–Meier curves showing the overall survival probabilities of patients in EVS-high versus EVS-low for the entire cohort, or (C) for the individual MB subgroups separately. The P-values were determined using a log-rank test, where P < 0.05 was considered significant (*).

