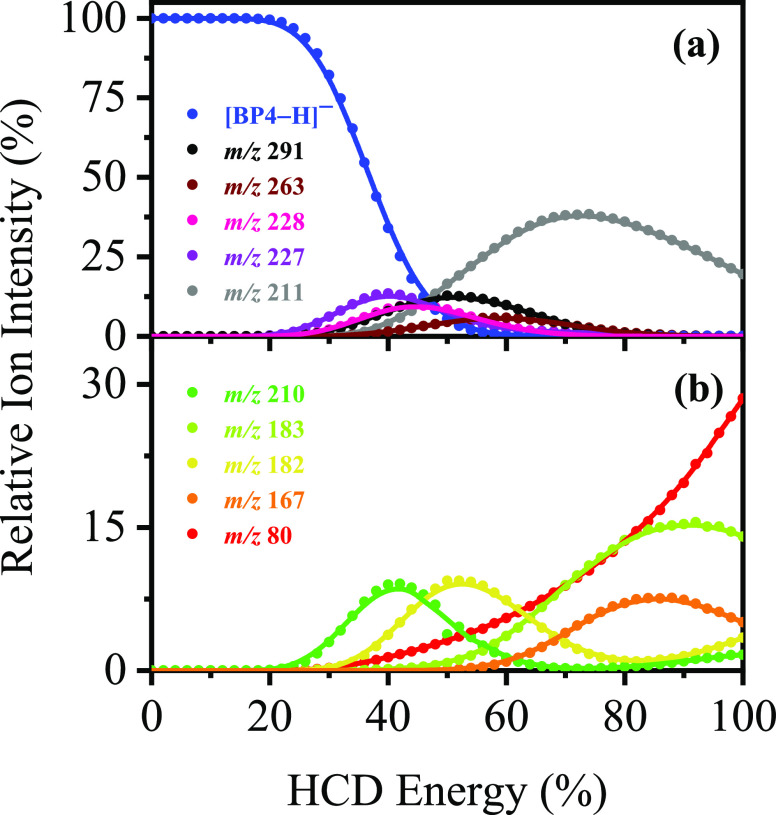
Figure 3.
Parent ion dissociation curves for [BP4–H]− highlighting its ten most intense thermal fragments between 0% and 100% HCD energy. The curved lines are a five-point adjacent average of such data points and are provided as a viewing guide, to emphasize the profile for each individual fragment.

