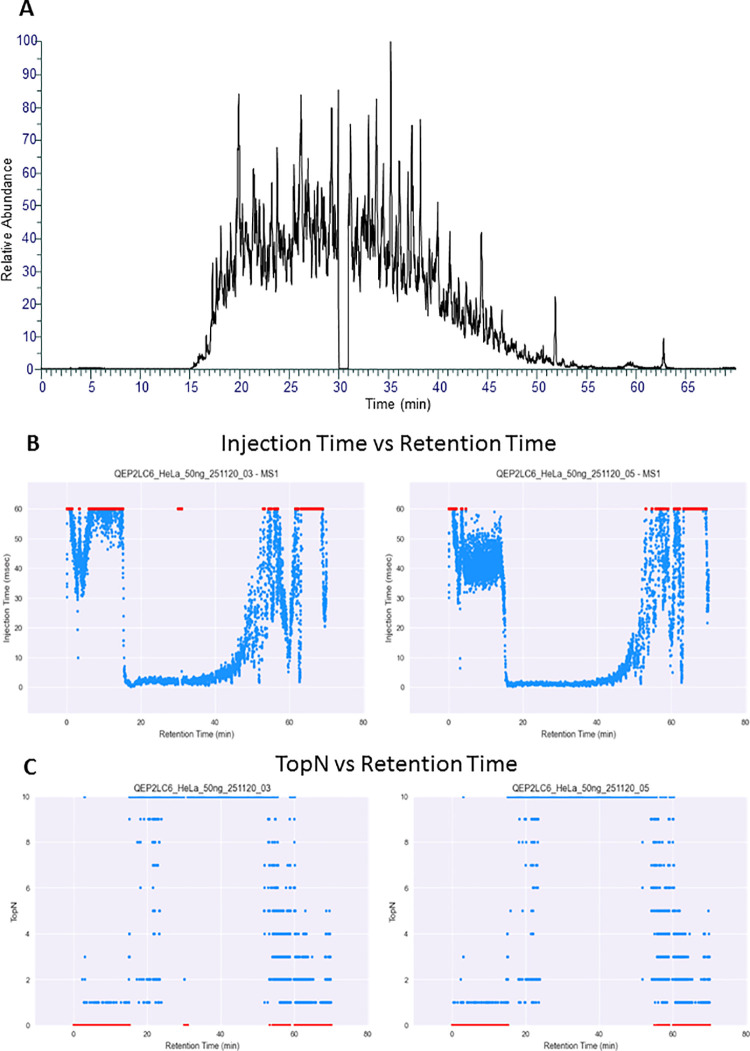
Figure 4.
(A) Chromatogram of sample 3, where we introduced zero spray voltage to simulate spray instability at 30 min for 1 min. (B) “Injection Time vs Retention Time” view from the RawBeans report. One can see the red dots at time 30 min of sample 3, indicating a brief drop in signal that, in turn, increases the injection time to the maximum. (C) “TopN vs Retention Time” view. One can see the red dots at 30 min at zero values.

