Figure 5.
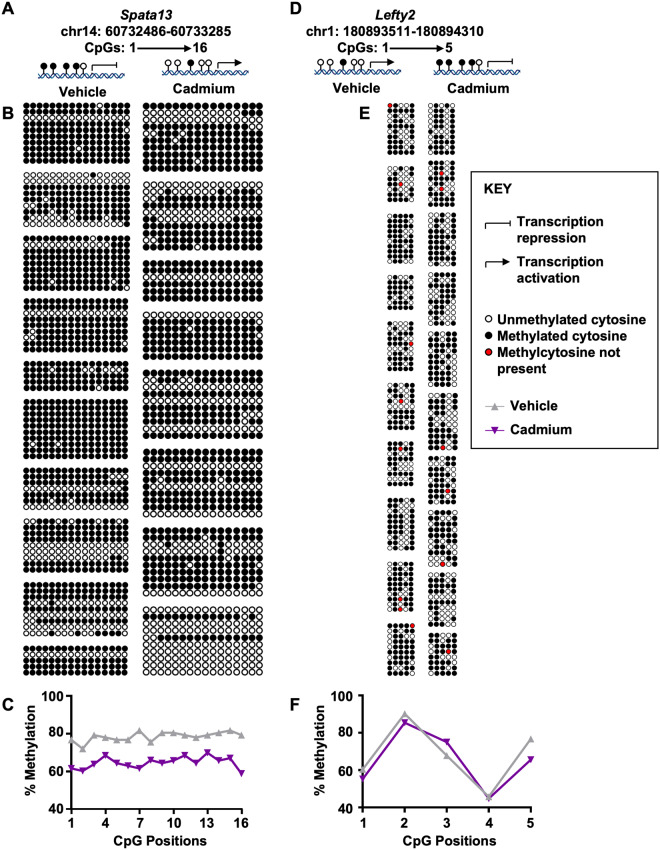
Validation by pyrosequencing of specific gene promoter loci of the reduced representation bisulfite sequencing data. A, Cartoon representation of chromosomal and CpG positions for Spata13 (chr14: 60732886) and possible effect of methylation status on transcriptional activity. B, Lollipop representation of bisulfite converted DNA (vehicle vs cadmium, n = 8–10 mice). C, Percent methylation at each of the CpG positions at the Spata13 promoter (top) and the Lefty2 promoter (bottom). D, Cartoon representation of chromosomal and CpG positions for Lefty2 (chr1: 180893911) and possible effect of methylation status on transcriptional activity. E, Lollipop representation of bisulfite converted DNA (vehicle vs cadmium, n = 8–10 mice). Each group (box) depicts a mouse. CpG locations are depicted from left to right and the number of clones after bisulfite pyrosequencing from top to bottom. Erroneous sequences and those with low conversation rate were removed, thus the differences in the sizes of each group (box).

