Figure 6.
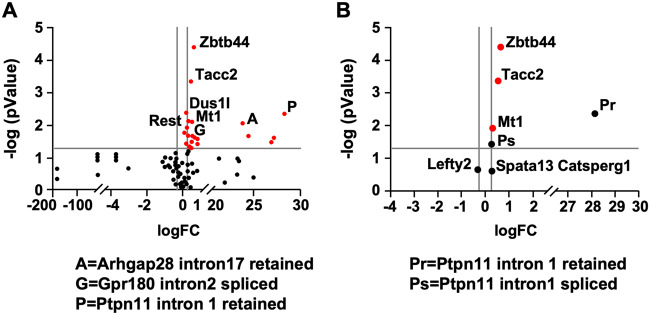
Cadmium-induced methylation patterns correlate to changes in gene expression patterns at both the transcript and alternative splicing levels in mice sperm. NanoString Direct Digital Detection through NanoString nCounter Analysis System was used to determine gene expression changes. Volcano plots of differential gene expression in sperm of vehicle versus cadmium-exposed mice are shown. A, Volcano plots showing top 177 genes. Genes with significant differential expression are shown in red while genes with no significant differential expression are shown in black. B, Volcano plots of selected genes of interest. Red dots depict the genes with significant differential expression; black dots depict genes hypothesized to play a role in spermatogenesis. Gray vertical lines depict the cutoffs for significance (logFc ≥ 0.263), while horizontal gray line depicts the threshold for significance (p < .05).

