Figure 5.
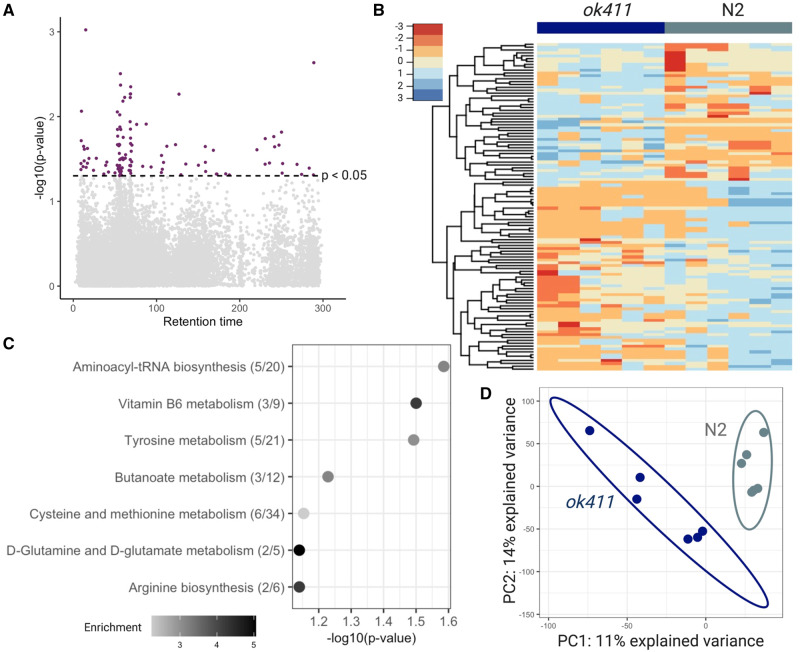
The cat-1 (ok411) strain shows patterns of altered metabolism. A, Manhattan plot shows features that were different with p < .05 (red) in cat-1 (ok411) mutants compared with wild-type N2 worms. B, Hierarchical clustering of features associated with the cat-1 (ok411) mutant with p < .05. C, Top pathways altered (Fisher’s exact test p-value < 0.1) in cat-1 (ok411) worms, analyzed using the Mummichog software. The overlap size of the pathway is indicated in parentheses (number of significant hits/pathway size). The color of the bubbles represent enrichment, calculated as the quotient of total number of hits in the pathway divided by expected number of hits. D, Partial least squares discriminant analysis (PLS-DA) comparing cat-1 (ok411) mutants to wild-type N2 worms. n = 6 with 500 worms in each sample for both groups.

