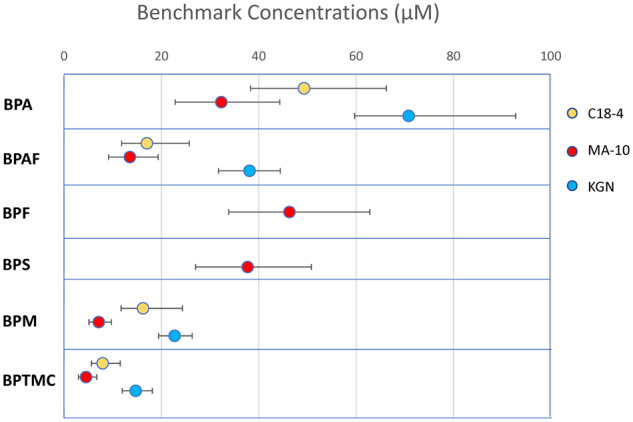
Figure 2.

Benchmark concentration (BMC) analyses of the cytotoxicity of bisphenols in C18-4, MA-10, and KGN cells: BMC values (μM) at which a 10% change was observed in the number of nuclei in comparison to control. Data points represent the BMC values, whereas ± bars represent the upper (BMCU) and lower (BMCL) values, respectively.
