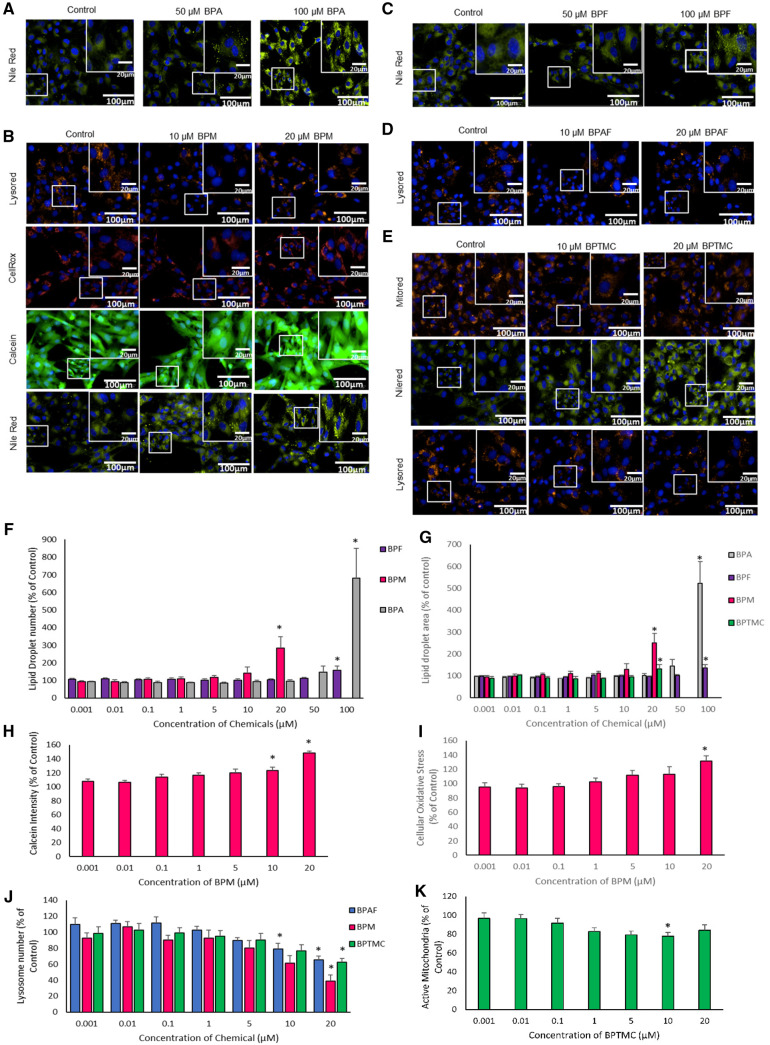
Figure 5.
Effects of bisphenols on KGN human granulosa cells. Cells were exposed for 48 h to each chemical followed by fluorescence microscopy using the Operetta High Content imaging system (40× magnification). A, Images illustrating the effects of BPA on lipid droplets; (B) effects of BPM on lysosome numbers, oxidative stress, calcein, and lipid droplet numbers in KGN cells; (C) effects of BPF on lipid droplet numbers in KGN cells; (D) effects of BPAF on lysosome numbers; (E) effects of BPTMC on active mitochondria, lipid droplet, and lysosome numbers. Lysosome numbers, oxidative stress, calcein intensity, active mitochondria, and lipid droplet numbers were determined using Lysored, CellRox, Calcein Mitotracker Red, and Nilered dye staining, respectively. Graphs illustrate results for the effects of: (G) BPF, BPM, and BPA on lipid droplet numbers; BPTMC on lipid droplet areas; (H) BPM on calcein intensity; (I) BPM on cellular oxidative stress; (J) BPAF, BPM, and BPTMC on lysosome numbers; and (K) BPTMC on active mitochondrial numbers. One-way ANOVA was conducted to determine concentrations at which there were significant effects *p < .05, Values represent means ± SEM, N = 5.

