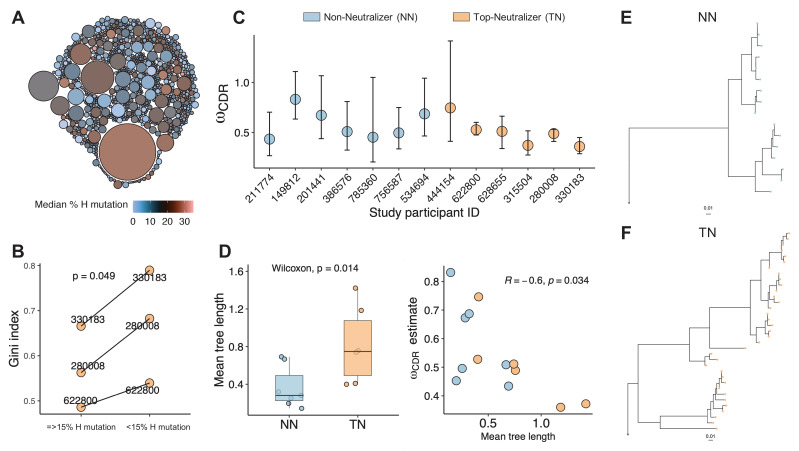
Figure 3. Clonality analysis.
A total number of 770 clones were obtained for top-neutralizers (TNs). (A) Each clone is represented as a circle. The sizes of the circles are scaled to the number of sequences in each clone (mean number of sequences 7.4); the colors represent mean number of mutations per clone. Dominant clones consist of highly mutated sequences. (B) Gini index (0 represents perfect equality and one perfect inequality) was calculated as an estimate of clonality for TNs for which a total of more than 600 sequences were obtained (subject IDs: 330183, 280008, 622800). Per each subject, sequences were divided into two sets as high mutated sequences (>60 mutations) and low mutated sequences (≤60 mutations). Each set of sequences were clustered into clones and Gini index was calculated. Gini Index is higher (paired t-test, p=0.04) in highly mutated sequence sets supporting the presence of fewer dominant clones. (C) Maximum likelihood point estimates of ω with 95% confidence intervals. (D) Estimates of mean tree length (total substitutions per codon within a lineage, averaged across all lineages within a repertoire) were compared between TN and non-neutralizer (NN) using Wilcoxon rank sum test (left graph). The correlation between ω and mean tree length calculated using Spearman’s correlation. Largest lineage trees in NNs (E) and TNs (F).

