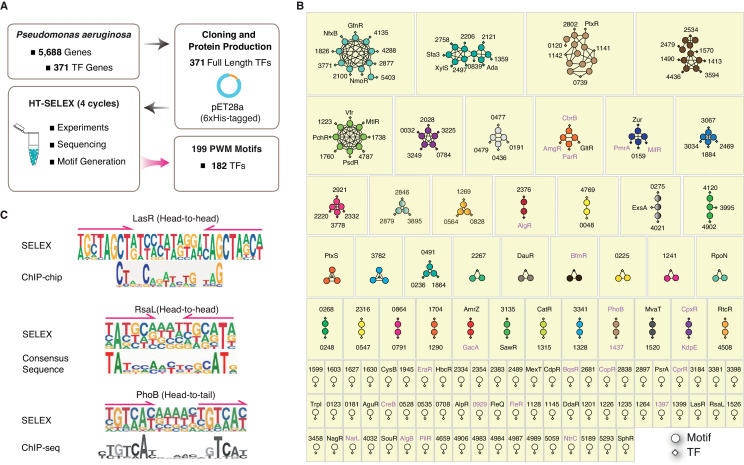
Figure 1. Summary of the HT-SELEX results in P. aeruginosa.
(A) Schematic description of protein expression and HT-SELEX procedure and output. (B) Network analysis of similarity of the obtained PWMs. Diamonds indicate TF genes, circles indicate individual PWMs. Edges are drawn between a TF and its PWM model, and between similar models if SSTAT similarity score >1.5e-05. To save space, ‘PA’ is omitted in all TFs names. The names of RRs of TCS are marked in pink font. (C) Comparison of the binding motifs of three TFs (LasR, RsaL, and PhoB) obtained from HT-SELEX (upper) and ChIP or cross-species sequence alignment methods (lower). Arrows indicate half-sites in dimeric sites. Also see Figure 1—figure supplement 1, Supplementary file 1.


