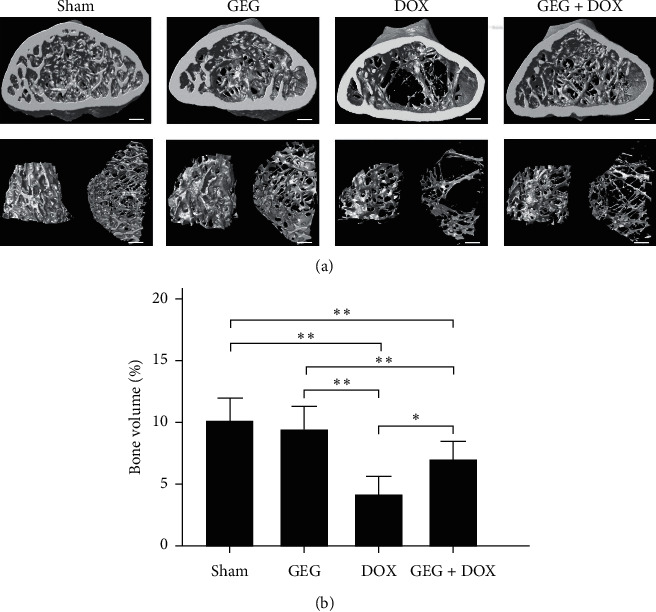
Figure 7.

Effects of GEG treatment on bone density in the tibia tissue of mice with and without DOX treatment. (a) Cross-sectional imaging of the tibia and trabecular bone among mice treated with sham, GEG, DOX, and DOX + GEG performed by high-resolution microcomputed tomography. Bar scale = 100 μm. (b) Comparison of the quantified bone volume percentage of the tibia among mice treated with sham, GEG, DOX, and DOX + GEG (N = 3 for each group). Values are expressed as the mean ± SEM (∗∗p < 0.01, ∗p < 0.05, one-way ANOVA followed by a Student–Newman–Keuls multiple-comparison posttest). Abbreviations: GEG, Guilu Erxian Gum; DOX, doxorubicin; SEM, standard error of the mean; and ANOVA, analysis of variance.
