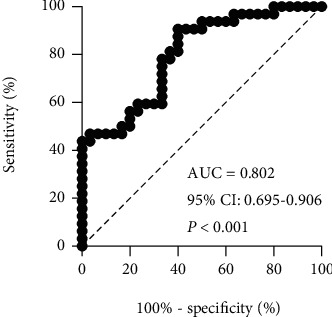
Figure 3.

Receiver operating characteristics (ROC) analysis for the combination of TS, SL, SL variability, StPT variability, and SwPT variability. The combination of those five gait parameters increased the predictive power with the highest AUC of 0.802 (95% CI 0.695–0.906, P < 0.001). TS: total steps; SL: stride length; SL variability: stride length variability; StPT variability: stance phase time variability; SwPT variability: swing phase time variability; AUC: area under the curve; CI: confidence interval.
