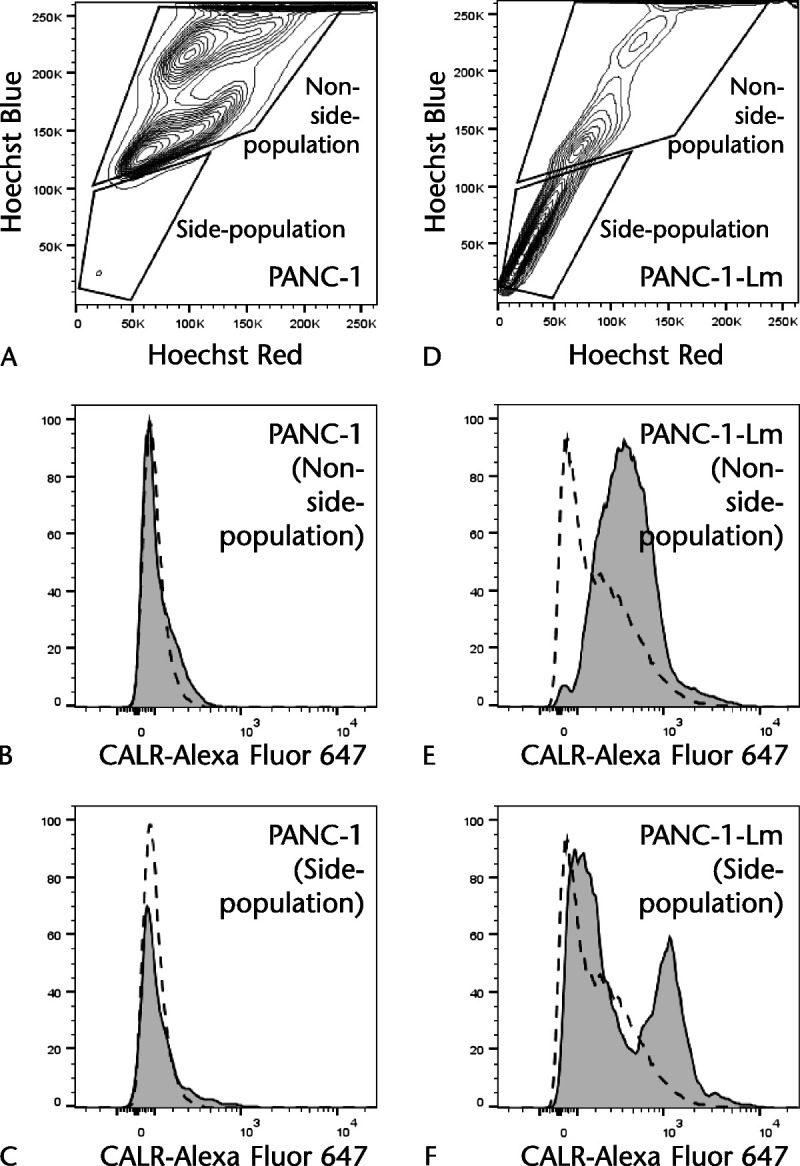
FIGURE 4.

Side population of PANC-1–derived cells. Cells were stained with Alexa Fluor 647–conjugated anti-CALR antibody and incubated with Hoechst 33342. The cells were excited with a 375-nm trigone-violet laser, and dual fluorescence signals were detected in PANC-1 (A) and PANC-1-Lm (D). The lower gate is the SP fraction, and the upper gate is the non-SP fraction, respectively. The CALR expression in the non-SP fraction from PANC-1-Lm (E) is higher than that from PANC-1 (B). The SP fraction from PANC-1-Lm (F) showed higher CALR expression than that from PANC-1 (C). Gray histograms and dotted lines represent cells stained with anti-CALR and isotype control antibodies, respectively.
