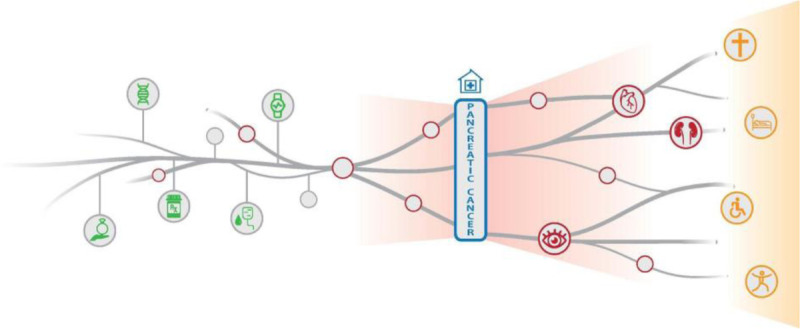
FIGURE 9.

Disease progression over the life course. The figure illustrates how diseases follow each other and how different patients develop different complications to the same disease over time. Events in early disease-free periods will in many cases influence disease risks and disease severity later in life. Big data disease analytics aim at finding such early events and symptoms with predictive value in relation to early diagnosis of for example pancreatic cancer. Courtesy of Jessica Xin Hjaltelin, University of Copenhagen.
