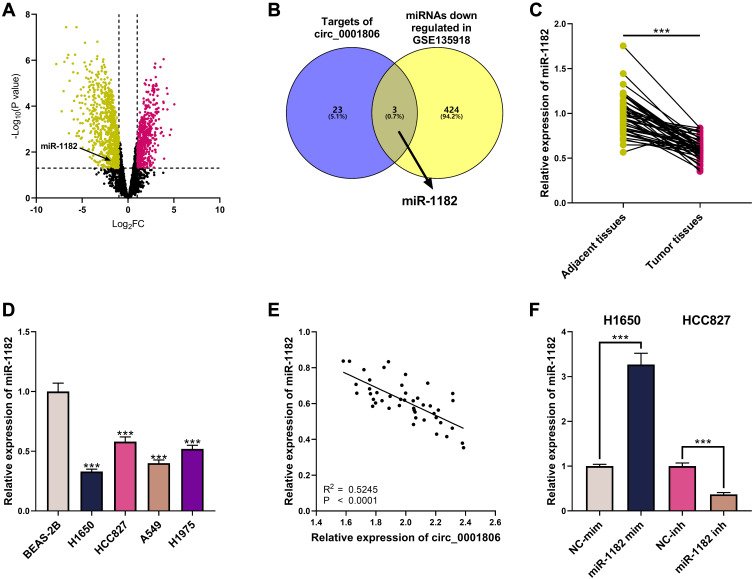
Figure 3.
Abnormally expressed miRNAs in NSCLC. (A) The volcano plot presented miRNAs whose expression was remarkably changed in NSCLC tissues relative to those in adjacent tissues in GSE135918. (B) miRNAs whose expression was remarkably down-modulated in GSE135918, and the downstream targets of circ_0001806 were predicted by circular RNA Interactome. (C) MiR-1182 expression in NSCLC tissues and adjacent tissues was detected by qRT-PCR. (D) MiR-1182 expression in BEAS-2B cells and NSCLC cells was detected by qRT-PCR. (E) The correlation between circ_0001806 expression and miR-1182 expression in NSCLC tissues. (F) The transfection efficiency of miR-1182 mim and miR-1182 inh was detected by qRT-PCR. *** means P < 0.001. In (A), yellow represents miRNAs that were markedly down-modulated (P < 0.05, Log 2 FC < 1), and red represents miRNAs that were remarkably up-modulated (P < 0.05, Log 2 FC > 1).

