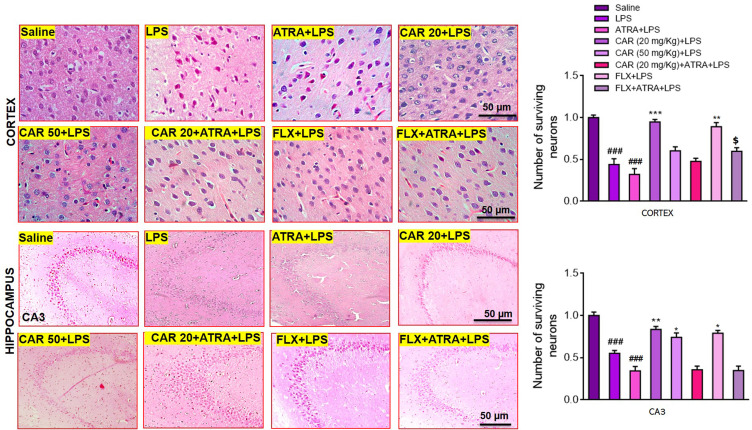
Figure 3.
Hematoxylin and eosin (H&E) staining showing the extent of surviving neurons in the cortex and hippocampus (Corno amonus, CA). Scale bar 50 μm, magnification 40×. Dead neurons were characterized by a swollen cytoplasm, vacuolization, scalloped morphology with intense cytoplasmic eosinophilia, and nuclear basophilia. Data are expressed as means ± SEM. ###p<0.001 indicates a significant difference compared to the saline group, *p<0.05, **p<0.01, ***p<0.001 is compared to the LPS group and $p<0.05 is compared to ATRA+LPS group. CAR 20: carvacrol (20 mg/kg); CAR 50: carvacrol (50 mg/kg); LPS: lipopolysaccharide; ATRA: all-trans retinoic acid; FLX: fluoxetine. The H & E slides were made after the euthanization of animals following behavioral analysis. The saline, LPS, CAR+LPS, and FLX+LPS groups were those studied in the first cohort (n=5/group), while the LPS+ATRA, CAR+ATRA+LPS, and FLX+ATRA+LPS groups were from the second cohort (n=4/group).

