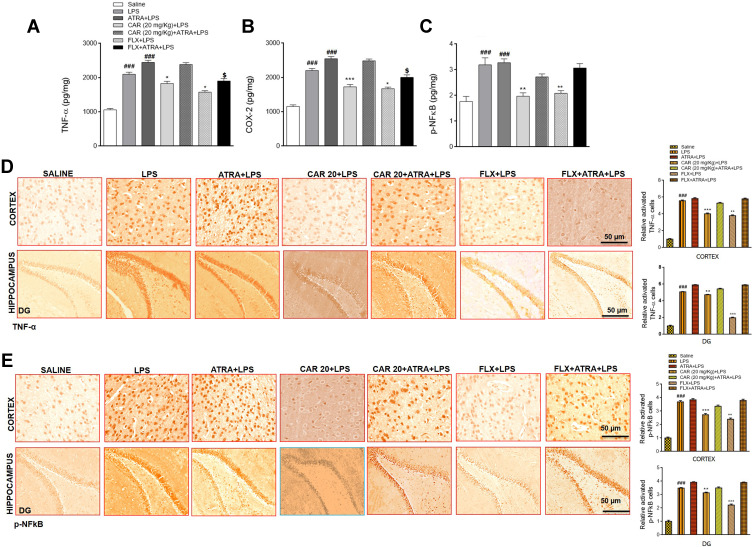
Figure 5.
Effects of carvacrol on LPS induced neuroinflammation. (A) TNF-α levels, (B) COX-2 levels, and (C) p-NFkB levels were measured by ELISA. Data are expressed as means ± SEM. ###p<0.001 indicates a significant difference compared to the saline group, *p<0.05, **p<0.01 and ***p<0.001 is compared to the LPS group and $p<0.05 is compared to ATRA+LPS group. (D) Immunohistochemistry results for TNF-α in the cortex and hippocampus. (E) Immunohistochemistry results for p-NFkB in the cortex and hippocampus. Scale bar 50 µm, magnification 40×. Data are expressed as means ± SEM. ###p<0.001 indicates a significant difference compared to the saline group and **p<0.01, ***p<0.001 is compared to the LPS group.
Abbreviations: CAR 20, carvacrol (20 mg/kg); CAR 50, carvacrol (50 mg/kg); LPS, lipopolysaccharide; ATRA, all-trans retinoic acid; FLX, fluoxetine; TNF-α, tumor necrosis factor-alpha; COX-2, cycloxygenase-2); p-NFkB, nuclear factor-kappa B.

