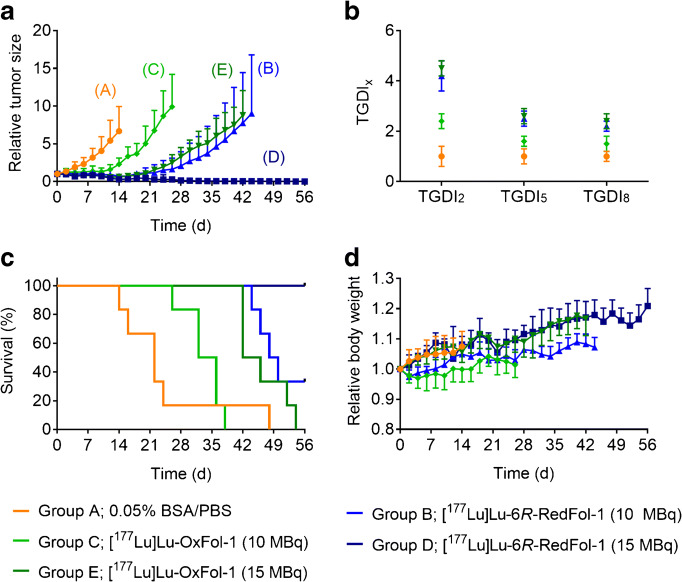
Fig. 4.
a Tumor growth curves relative to the tumor volume at day 0 (set as 1.0) for mice that received PBS (group A), mice treated with [177Lu]Lu-6R-RedFol-1 (group B/D) or [177Lu]Lu-OxFol-1 (group C/E). b TGDI2, TGDI5, and TGDI8 determined for respective groups (TGDIs of group D were not determined due to RTV below the threshold value). c Kaplan-Meier plot of groups A–E. d Relative body weight of groups A–E. Tumor growth and body weights are shown until the first mouse of the respective group reached the endpoint

