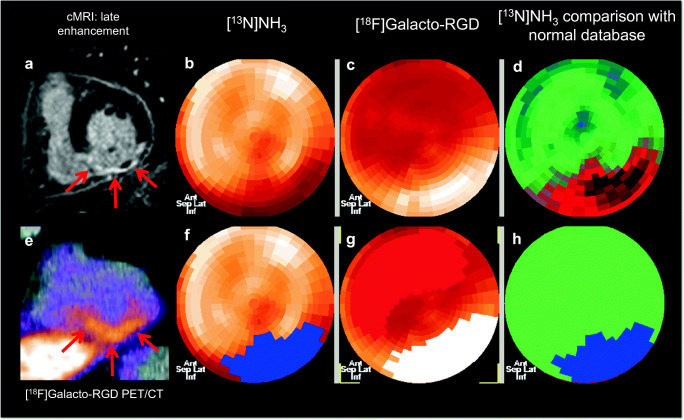
Fig. 1.
Image analysis in a patient with inferior wall myocardial infarction. Cardiac MRI (A: short axis late enhancement images) shows intense contrast enhancement in the inferior wall with central no reflow phenomenon indicative of a severe transmural infarction (red arrows). [13N]NH3 PET (B, F: polar maps; D, H: comparison with normal database) shows severely impaired blood flow in the inferior wall, the areas coded in red in D indicate areas with substantially lower flow compared with normal myocardium in a reference population, and the areas in blue in H indicate areas defined as infarcted using a threshold of 0.5 ml/min/g. [18F]Galacto-RGD PET/CT (C: polar map without ROIs, G: polar map after manual delineation of the ROI for the infarct area (white) and the remote myocardium without increased [18F]Galacto-RGD uptake, with normal perfusion and without late gadolinium enhancement (red); E: short axis PET/CT fusion image) shows pronounced tracer uptake in the area of infarction in the inferior wall with no tracer uptake in normal remote myocardium

