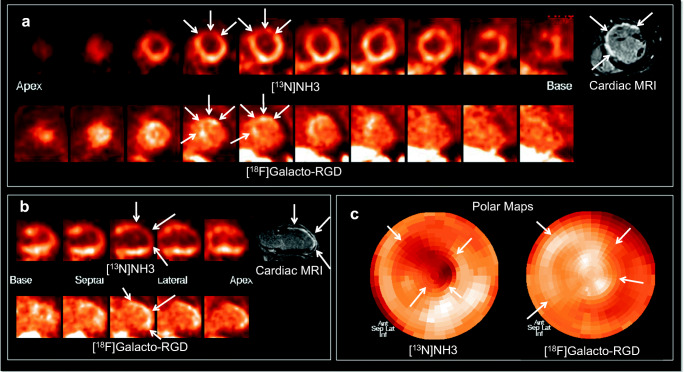
Fig. 2.
Patterns of [18F]Galacto-RGD uptake in myocardial infarction. [13N]NH3 and [18F]Galacto-RGD PET as well as late enhancement cardiac MRI is shown (A: short axis; B: vertical long axis; C: polar maps). A large area of infarction with predominantly transmural contrast enhancement is shown in cardiac MRI in the anterior and anteroseptal wall with severely impaired blood flow in [13N]NH3 PET (arrows). [18F]Galacto-RGD PET shows tracer uptake in the area of infarction; however, note that the tracer uptake also extends to areas adjacent to the infarcted areas into myocardium with normal or only slightly impaired blood flow (arrows), which is especially well demonstrated in the polar maps (C)

