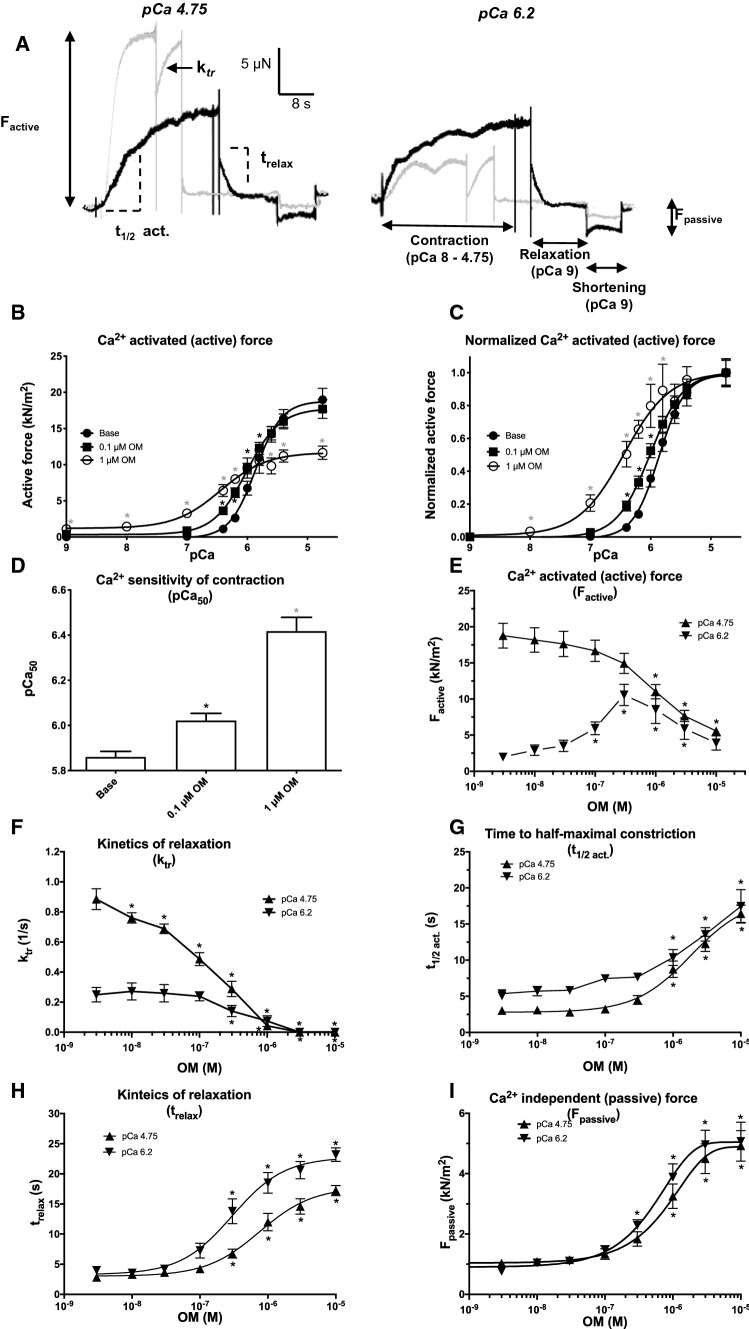
Fig. 1.
Omecamtiv mecarbil evokes Ca2+ sensitization, slower contraction–relaxation kinetics and increased passive stiffness in permeabilized human cardiomyocytes. Original force recordings at maximal (pCa 4.75; ≈18 μM) and submaximal (pCa 6.2; ≈0.63 μM) Ca2+ concentrations illustrate the effects of 1 µM omecamtiv mecarbil (OM) on force development in isolated, permeabilized human left ventricular cardiomyocytes. Gray traces: controls; black traces: the same cells with OM (a). Steps of the measurement are indicated at pCa 6.2 (black trace). First, the permeabilized ventricular cardiomyocyte was placed in a Ca2+-containing solution and the developing Ca2+-dependent force was recorded. Then the preparation was transferred to a relaxing solution (pCa 9). After steady-state relaxation, the passive stiffness was determined by shortening the sarcomeres to a slack level. The Ca2+ concentration–active force relationship was determined (shown in absolute and relative [normalized] units in panels (b) and (c), respectively) without (baseline) and with 0.1 and 1 µM OM (as indicated). The bar graph (d) represents the mean ± standard error of the mean (SEM) of seven to nine individual measurements (a significant difference [P < 0.05] from baseline is indicated by an asterisk). OM had a biphasic effect on the active force development as shown by the concentration–response graph at pCa 4.75 (e). The overall rate of active force development (ktr; f) and the time required for half-maximal Ca2+-dependent force development (t1/2 act; g) are shown on the graphs. Finally, the rate of relaxation (trelax; H) and the passive (Ca2+-independent) stiffness (Fpassive; i) were also determined at different OM concentrations. The applied OM concentrations are shown on the horizontal axes. Symbols represent the mean of seven to nine independent determinations. Error bars indicate the SEM

