Figure 2.
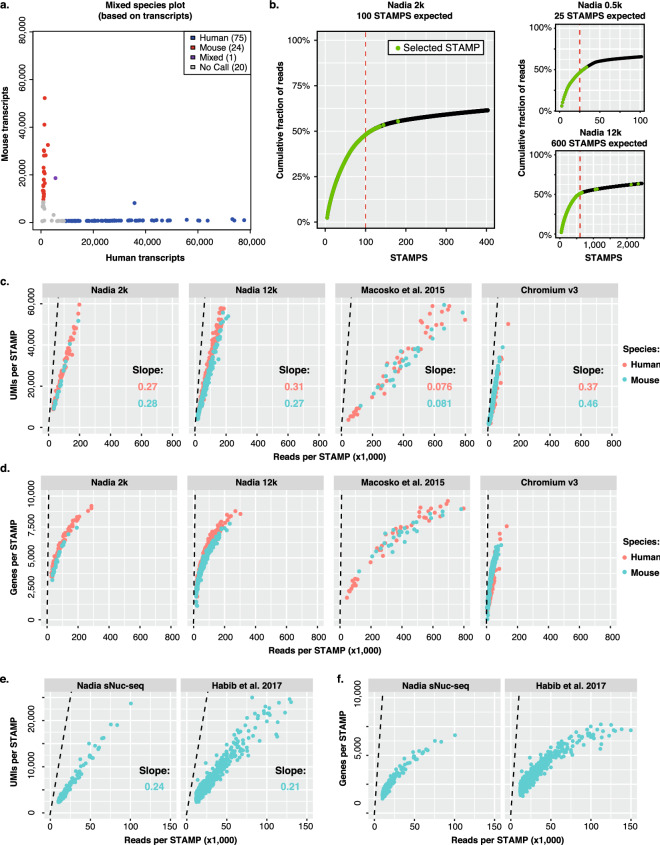
Technical performance for single cell and single nuclei sequencing. (a) Mixed species barnyard plot of transcripts after profiling 2,000 collected beads (i.e. 100 expected STAMPs) representing a mix of human HEK293 cells and mouse 3T3 cells input at platform recommended cell loading density of 3 × 10⁵ cells per ml. (b) Cumulative frequency plots reporting sequencing reads associated with individual barcodes when using indicated starting bead inputs for cDNA library construction. Dashed red lines indicate expected STAMPs for each experiment. Larger panel represents dataset used in (a). “Nadia 2k” generated cDNA libraries from 2,000 beads, “Nadia 0.5k” from 500 beads, and “Nadia 12k” from 12,000 beads. (c) Number of UMIs detected relative to individual STAMP read counts for indicated mixed-species whole cell experiments (see “Methods” section). “Nadia 2k” profiled 2000 collected beads and expected 100 STAMPs, “Nadia 12k” profiled 12,000 beads and expected 600 STAMPs, “Macosko et al.9” expected 100 STAMPs, “Chromium v3” expected 1400 STAMPs. Dashed line represents maximal point at which each sequencing read would report a unique UMI. (d) Same as C but with detected genes reported rather than UMIs. (e) Number of UMIs detected relative to individual STAMP read counts for indicated mouse 3T3 experiments (see “Methods” section). Dashed line represents maximal point at which each sequencing read would report a unique UMI. (f) Same as E but with detected genes reported rather than UMIs.

