Figure 3.
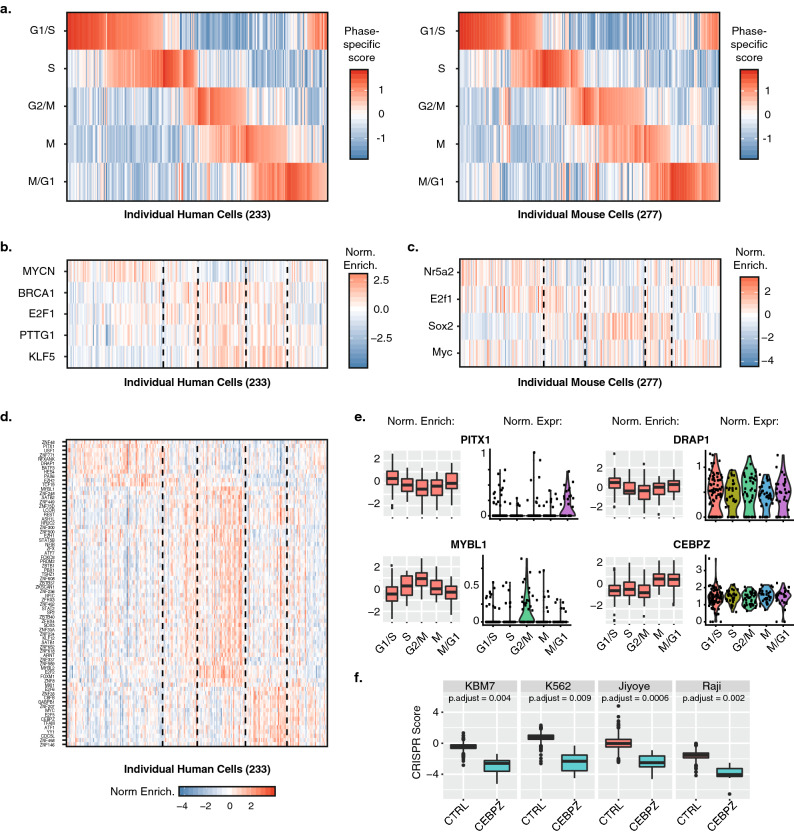
Elucidating transcriptional regulatory networks of the cell cycle. (a) Inferred cell cycle states of 233 human HEK293 cells (left panel) and 277 mouse 3T3 cells (right panel) based on the gene expression profiles of individual cells relative to stage-specific gene sets (see “Methods” section). Cells are ordered by the combination of phases switched on in each individual cell. (b) Inferred activity of indicated transcription factors based on TRRUST defined regulon expression in individual human HEK293 cells. Dashed lines highlight cell cycle phase assignments used to determine correlation to transcription factor activity. Normalised scores for each transcription factor have been mean centred across all cells. (c) Same as (b) but for mouse transcription factors and individual mouse 3T3 cells. (d) Inferred activity of indicated transcription factors in individual human HEK293 cells based on the summarised expression of regulons that had been inferred from 24 TCGA human cancer tissue sets. Dashed lines highlight cell cycle phase assignments used to determine correlation to transcription factor activity. Normalised scores for each transcription factor have been mean centred across all cells. (e) Boxplots showing normalised inferred activity and normalised gene expression across different phases for selective transcription factors shown in (d). Normalised activity and expression scores for each transcription factor were mean centred across all cells before being summarised by assigned cell cycle phase. (f) Boxplots showing CRISPR scores in four independent cell lines when using control sgRNA (n = 953) or sgRNA targeting CEBPZ (n = 7). CRISPR scores reflect the log2 fold change of each sgRNA detected in the cell lines between the start and end (~ 14 population doublings) of pooled CRISPR depletion experiments.

