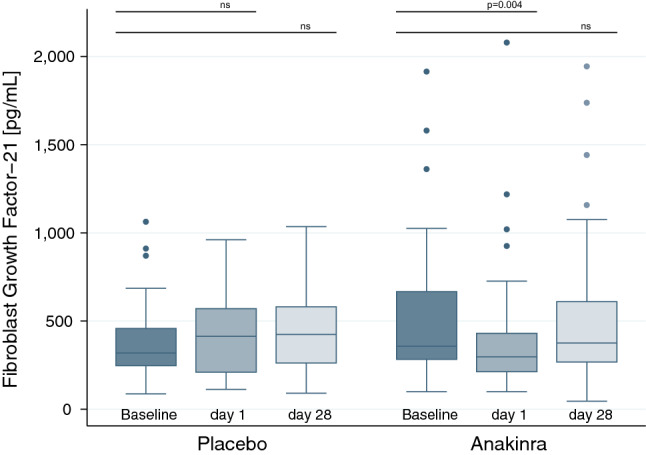
Figure 1.

Box plots of FGF21 levels at baseline (dark blue) and after short-term treatment (medium blue) as well as after longer-term treatment (light blue) in patients randomized to placebo or anakinra from Trial B, respectively. P-values were determined using a linear mixed model. Each box signifies the upper and lower quartiles, while the median is represented by a line within the box. Whiskers represent the upper and lower adjacent values, outliers are depicted as dots.
