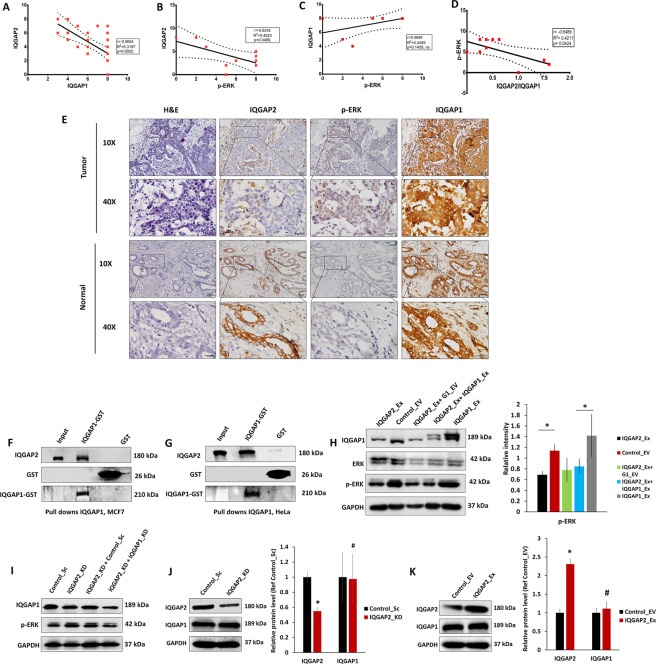
Fig. 7. IQGAP2 is negatively correlated with phospho-ERK and interaction of IQGAP2 with IQGAP1 modulates IQGAP1 function.
A Pearson correlation between the expression of IQGAP2 and IQGAP1 in tissues of breast cancer (r = −0.56, n = 38). B Pearson correlation between the expression of IQGAP2 and phospho-ERK (r = −0.63, n = 10) in tissues of breast cancer. C Pearson correlation between the expression of IQGAP1 and phospho-ERK (r = 0.49, n = 10) in tissues of breast cancer. D Pearson correlation between the expression of the ratio of IQGAP2/IQGAP1 and phospho-ERK (r = −0.64, n = 10) in tissues of breast cancer. In A–D solid and dashed line show regression line and standard error, respectively. E Representative IHC images of IQGAP2, phospho-ERK, and IQGAP1 in the normal and tumor region of a breast cancer patient. F Western blot images showing status of IQGAP2 in pull-down assay performed with IQGAP1_GST and GST only in MCF7 cells. The blots were probed with anti-IQGAP1, anti-IQGAP2, and GST antibodies. G Western blot images showing status of IQGAP2 in pull-down assay performed with IQGAP1_GST and GST only in Hela cells. The blots were probed with anti-IQGAP1, anti-IQGAP2, and GST antibodies. H Left panel shows Western blot of phospho-ERK in MCF7 cell having IQGAP2 overexpression (IQGAP2_Ex), IQGAP2 empty vector (Control_EV), IQGAP2 overexpression with IQGAP1 empty vector (IQGAP2_Ex + G1_EV), overexpression of IQGAP2 on IQGAP1 overexpression (IQGAP2_Ex + IQGAP1_Ex) background, and IQGAP1 overexpression (IQGAP1_Ex). Right panel shows corresponding densitometry data (n = 3). I Western blot of phospho-ERK in MCF7 cell having depletion of IQGAP1 and IQGAP2 (IQGAP2_KD + IQGAP1_KD), depletion of IQGAP2 with control vector for IQGAP1_KD (IQGAP2_KD + Control_Sc), IQGAP2 depletion (IQGAP2_KD), and its control vector (Control_Sc). J Western blot (left) showing expression of IQGAP1 in MCF7 with IQGAP2 reduction (IQGAP2_KD) and its control (Control_Sc). The bar graph (right panel) shows corresponding densitometry data (n = 3). K Western blot (left) image for IQGAP1 expression in MCF7 with IQGAP2 overexpression (IQGAP2_Ex) and its control (Control_EV). The bar graph (right panel) shows corresponding densitometry data (n = 3). Data are presented as mean ± SEM. Student’s t test, two-tailed unpaired was used for the comparison of means. #p > 0.05, *p ≤ 0.05.

