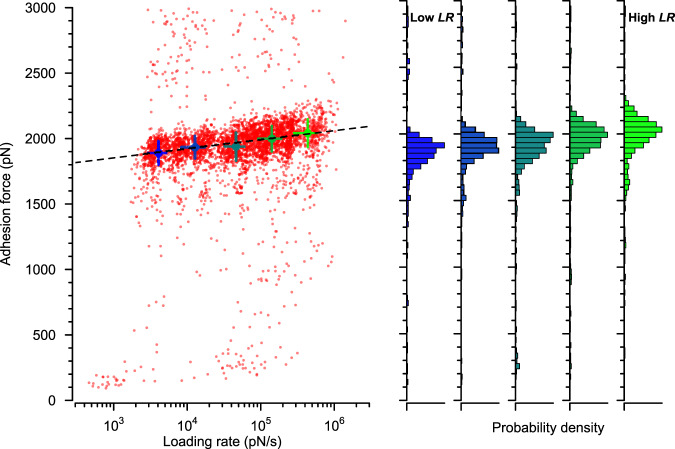
Fig. 3. Force-loading rate dependence for the vWF-vWbp-ClfA ternary interaction follows Bell–Evans dynamics.
Left: dynamic force spectroscopy plot of rupture force vs loading rate (n = 2992 curves from 3 cells, for individual data from 6 cells see Supplementary Fig. 2). The dotted line shows the extrapolated Bell–Evans fit through the most probable (mean) rupture forces and loading rates for five log-equispaced loading rate bins shown as solid circles. Error bars are the standard deviations. Right: corresponding histograms of the plot shown on the left.

